Publishers can gain a wealth of actionable insights from Marfeel’s Explore view. By examining historical data on subscriptions, it is possible to identify patterns and trends in user behavior and use this information to optimize conversion strategies.
As shown below, you can use the data to identify the most successful sources for acquiring new subscribers, whether it’s Google Discover or your own home page. Identify the articles or sections that are most likely to convert readers into subscribers. You can also use the data to identify patterns in user engagement and loyalty and to develop strategies for retaining subscribers over the long term. With the Explore view, subscription managers can gain a comprehensive understanding of their subscribers’ behavior to achieve maximum success.
How to Use Explore View for Conversions
Here are the metrics and dimensions that subscription managers can leverage with the Explore View:
Metrics:
- Average RFV: RFV stands for Recency, Frequency, and Volume, and reflects user behavior on a given site.
- Accumulative RFV: The RFV scores of all users added up over a selected time period, providing a comprehensive view of the user engagement on the site.
- Unique users: The number of individual users who have visited the site over a selected time period.
Dimensions:
- Visitor loyalty: This funnel divides users into different groups based on their RFV score, which measures the recency, frequency, and volume of their site visits. The groups are:
- Loyals and lovers: users with high RFV scores who visit the site frequently, and often, and consume a lot of content when they do.
- Casual and fly-by: users with lower RFV scores who visit the site less often and/or consume less content.
- New: first-time visitors to the site. Note that an anonymous user accessing the site on a certain device for the first time will be considered new. At registration, Marfeel conducts device reconciliation.
- User journey: This dimension allows subscription managers to analyze user behavior based on their subscription status. Users can be categorized as:
- Subscriber: users who have an active subscription
- Registered: users who have created an account but do not have an active subscription
- Anonymous: users who have not registered or subscribed to the site.
How do our most loyal users access our site?
To find out, search for Unique users filtered by Visitor loyalty = Loyal, lover grouped by Traffic source with internal.
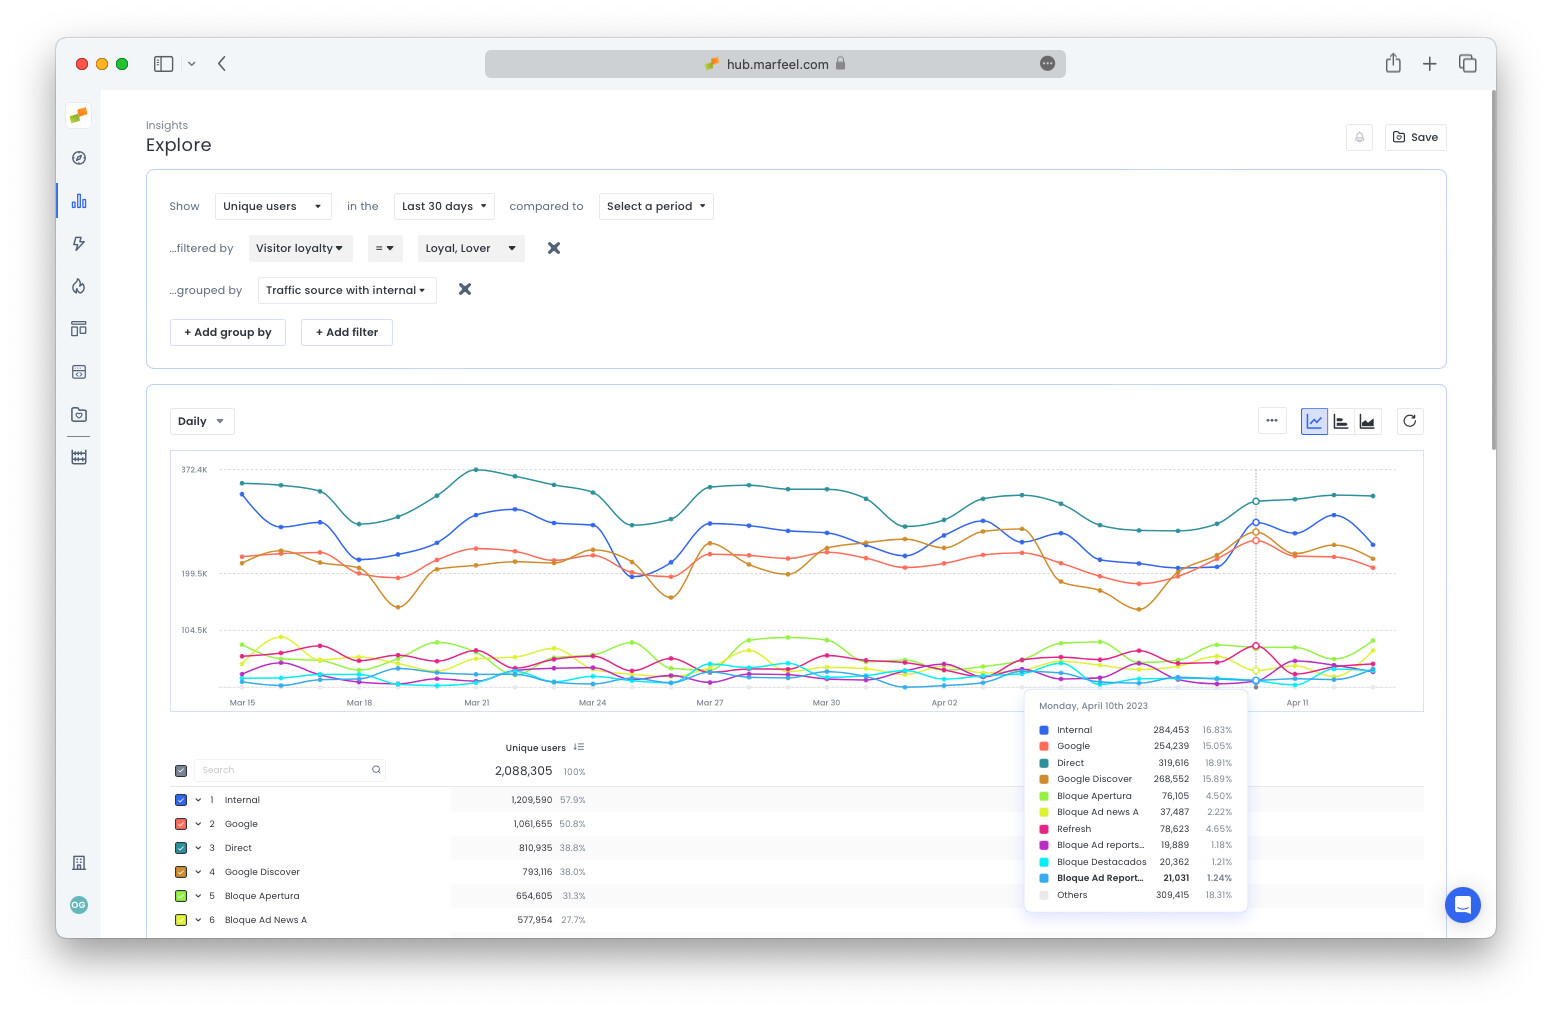
In the example above, four main traffic sources stand out:
- Internal (unassigned internal traffic)
- Direct
- Google Discover
Learn more about how Marfeel attributes traffic sources here.
See this query in Explore.
What is the level of engagement among subscribers last month compared to last month?
To find out, search for Cumulative RFV, Avg. RFV, and Unique usersin theLast 30 dayscompared to thePreceding periodfiltered byUser journey = Subscriber`:
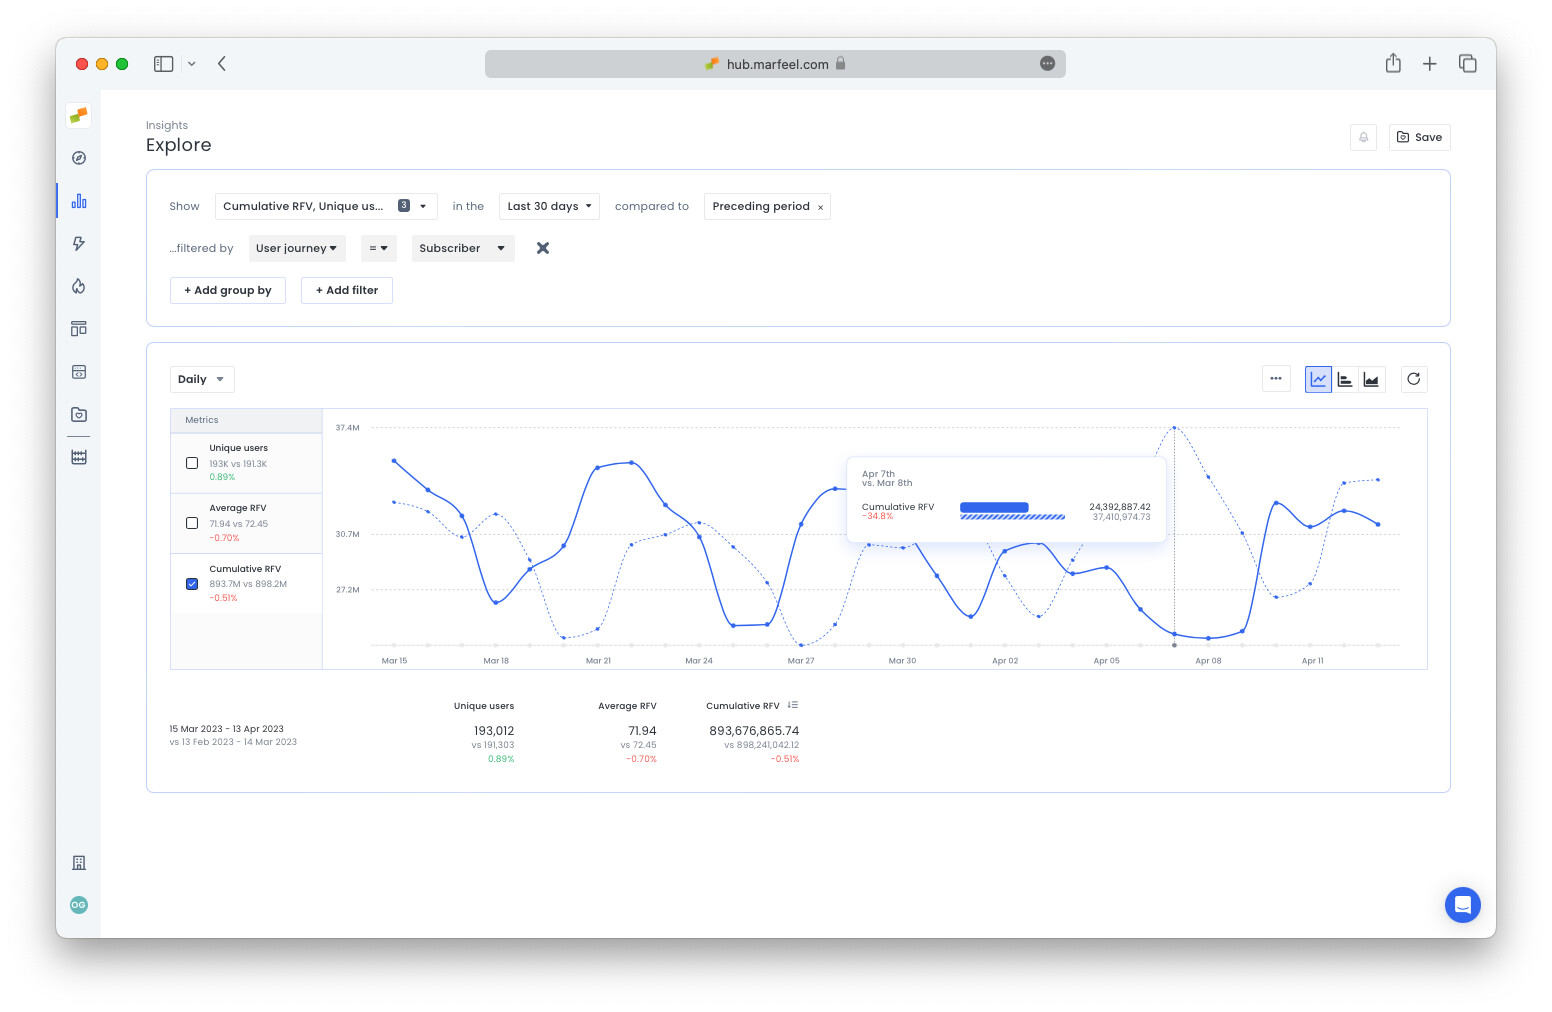
Hover over the data to go deeper into sharp increases or decreases. In the example above, the external event International Women’s Day had an effect on subscriber engagement, but things have generally evened out over the course of two months.
See it in Explore.
What was their level of engagement by section?
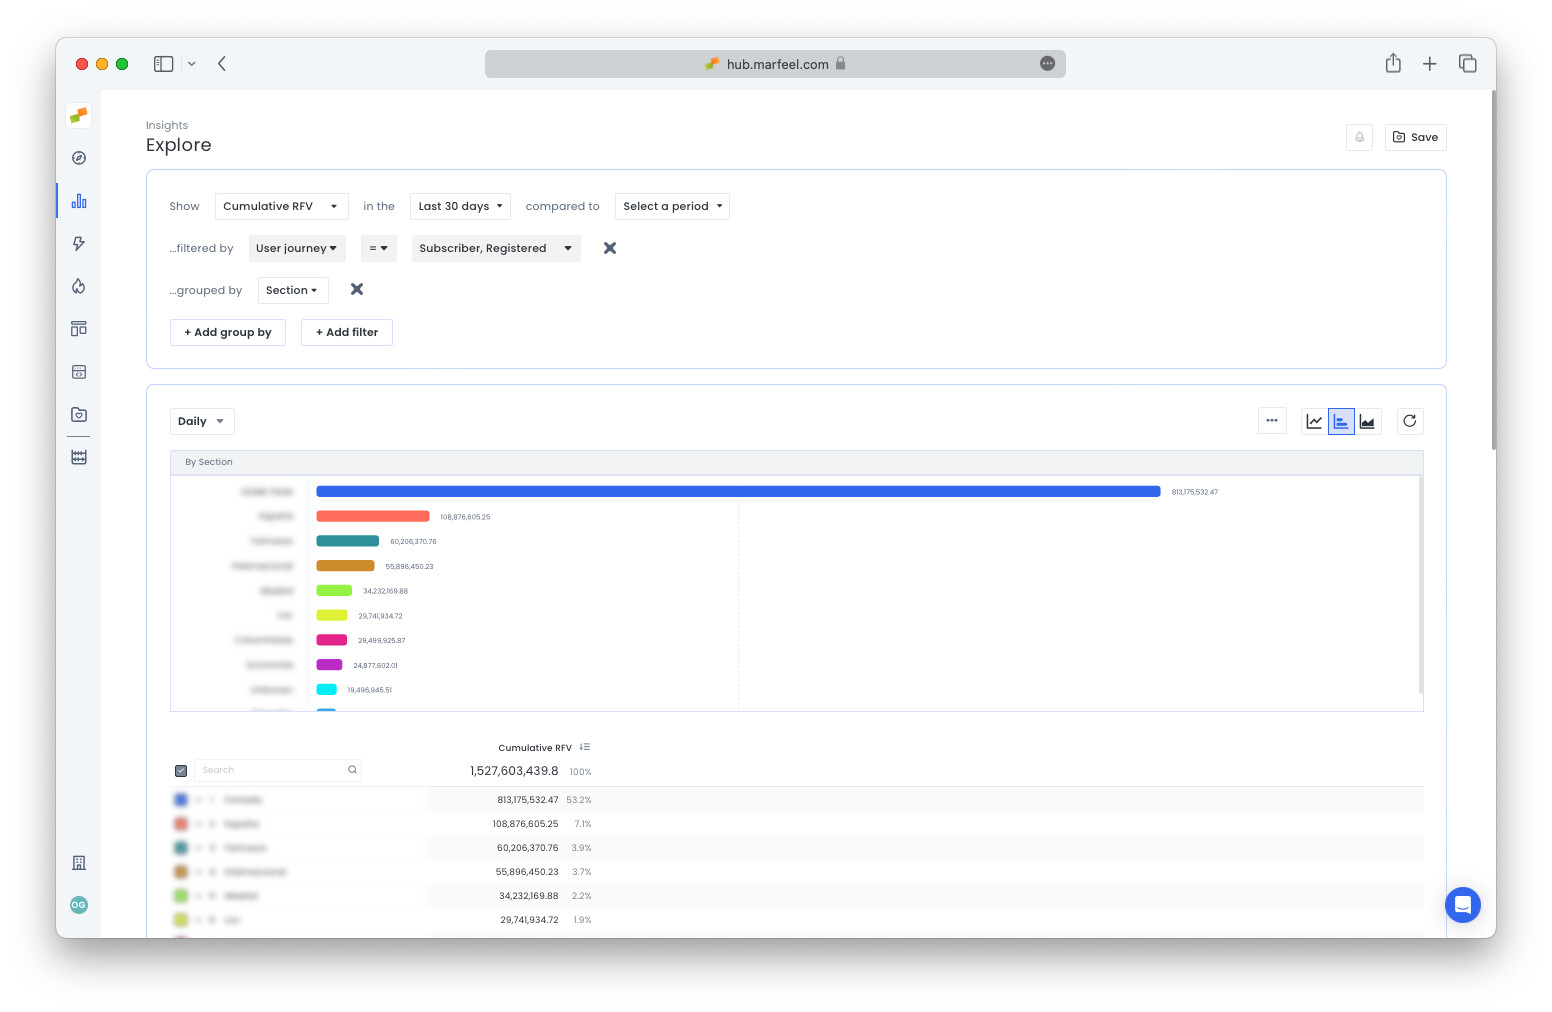
In the example above, the home page is where subscribers and registered users spend the most time, by a long shot.
See it in Explore.
What are the favorite sections among loyal fans of the publication who are not yet signed up?
Search for Unique users filtered by Visitor loyalty = Loyal, Lover and User type = Anonymous grouped by Section.
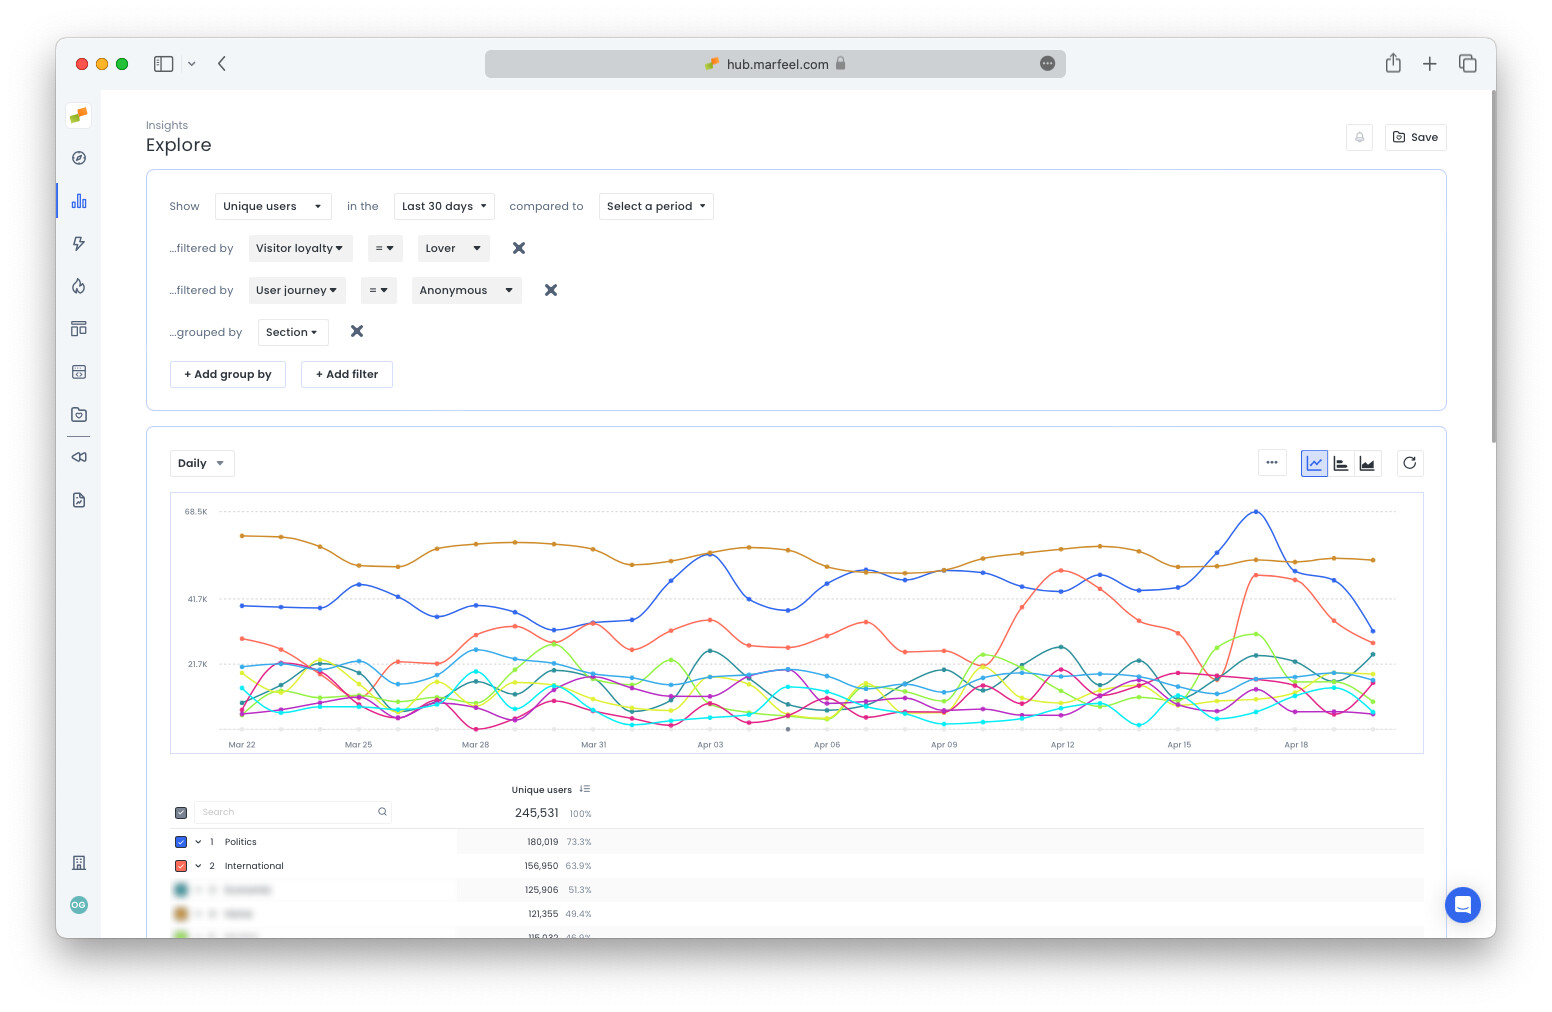
See it in Explore.
As shown in the example above, the mostly likely segments of your loyalty funnel to convert make frequent visits to the home page. This is why Marfeel has incorporated subscription optimization into the HUD, so that home page editors can grant visibility to stories with a high propensity to convert.
Which sections interest the users who pay for content, but are infrequent users of the site?
To see which sections these users at a high risk for churn are engaging with, search for Unique users filtered by Visitor loyalty = Casual, Fly by and User type = Subscriber grouped by Section.
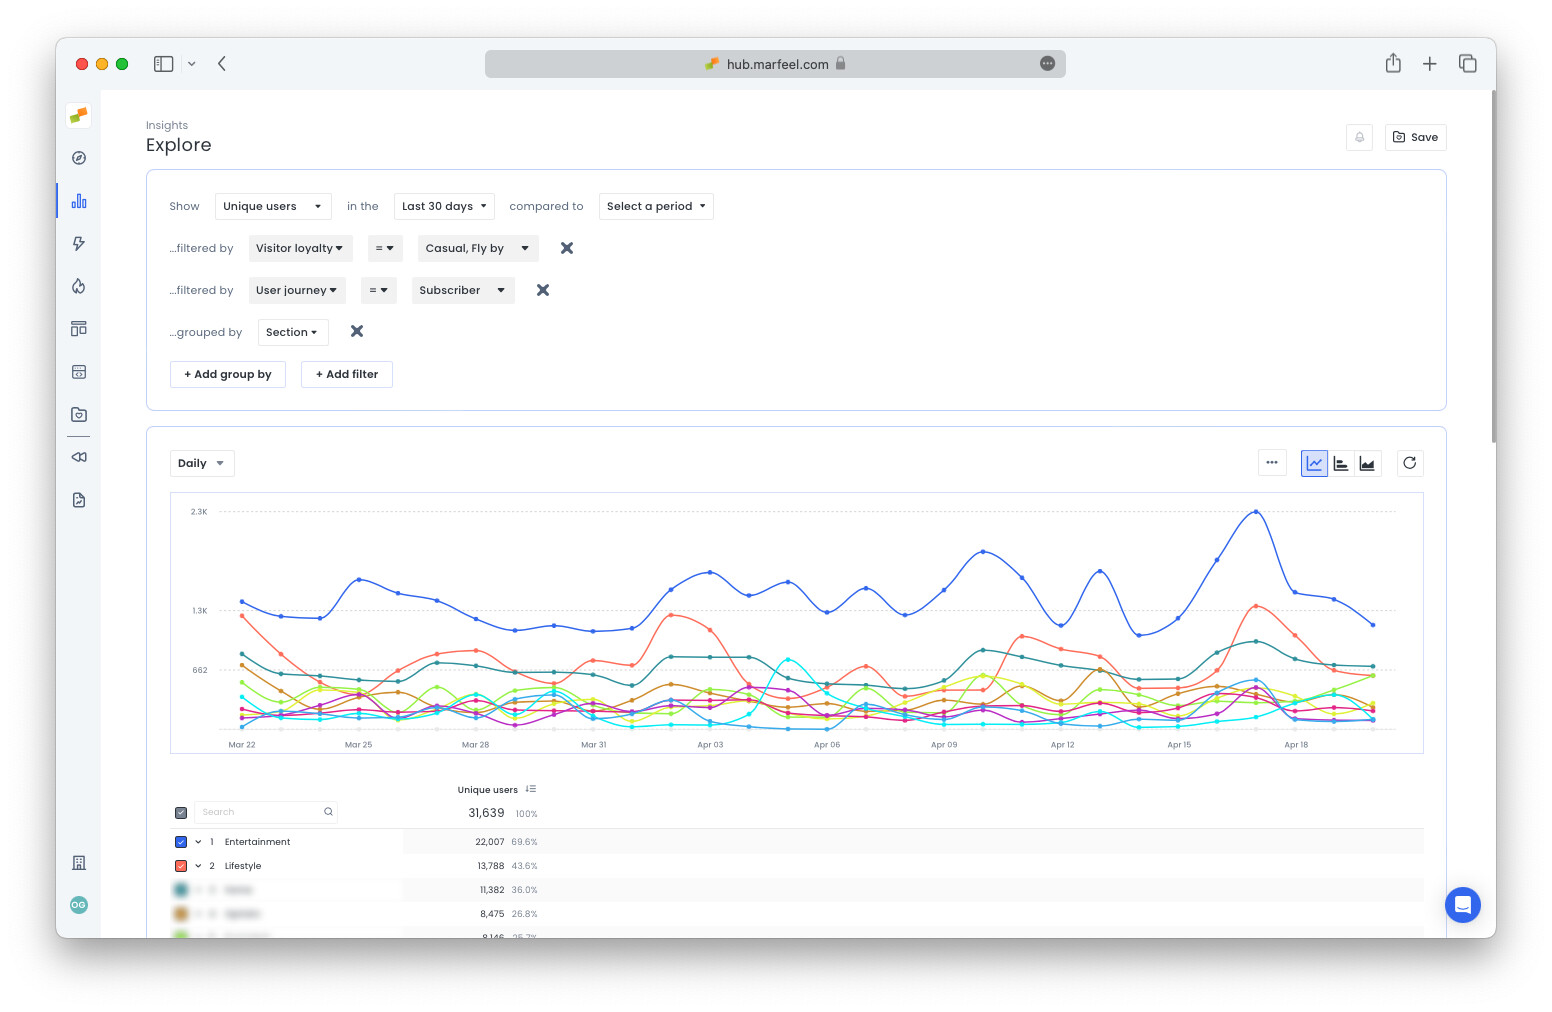
See it in Explore.
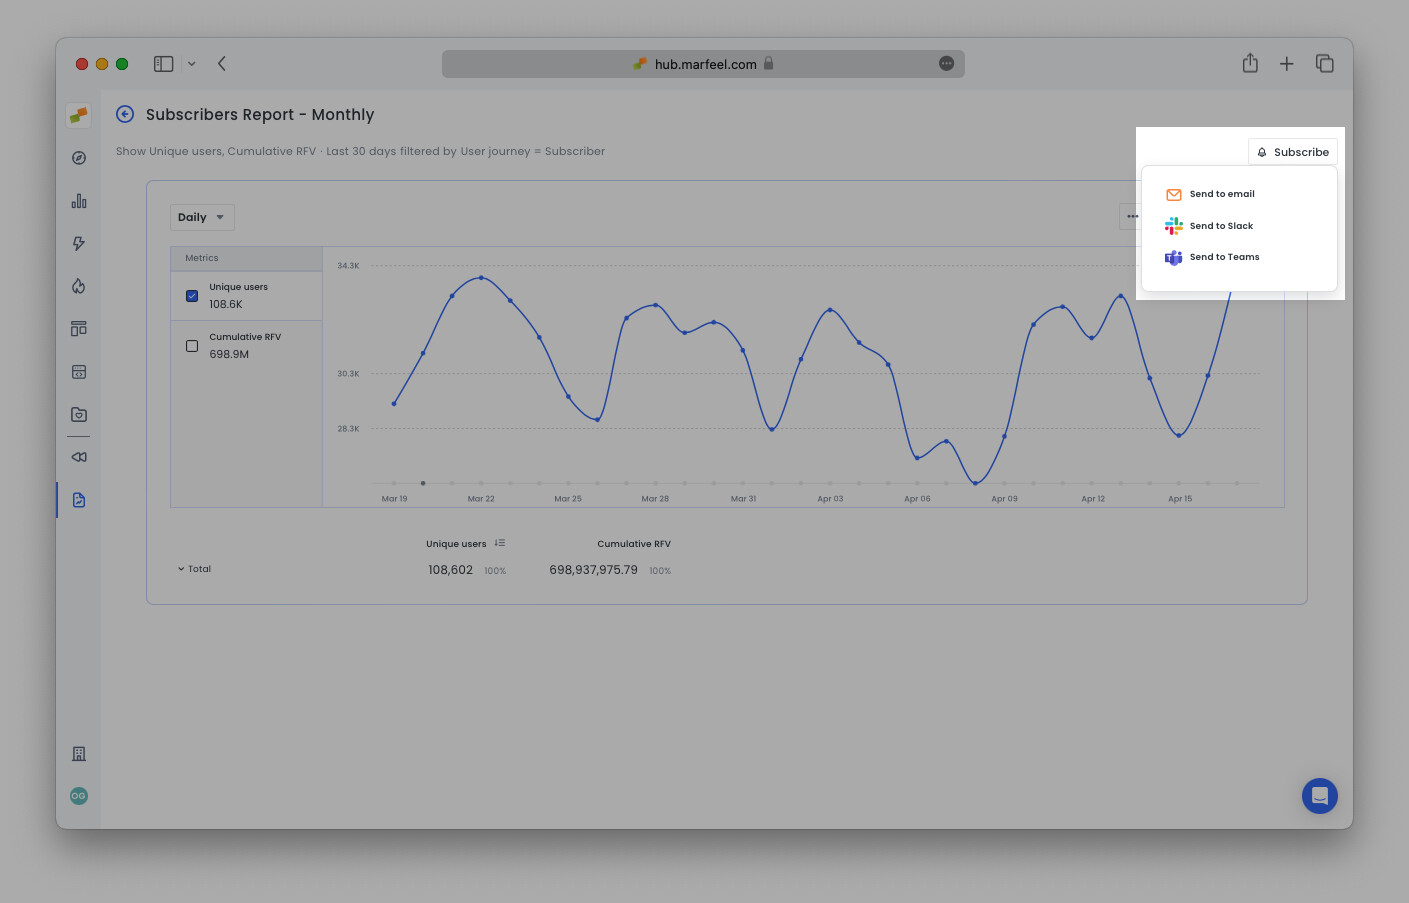
Sharing insights: Save Explore reports
Click the Save button in the top-right corner to save any Explore report to a workspace for future reference or share with team members. Once you have saved the report, you have the option to Subscribe to receive the report in your inbox or a Slack or Microsoft Teams channel at regular intervals. Subscribe to reports to stay on top of conversion trends and keep the whole team in the know.
Learn more:
- Optimize your site and content for conversions
- View subscriptions in real time and user journies in Compass
- Increase subscriptions with home page optimization using the Heads Up Display