Marfeel allows users to understand which links users are clicking on in two different ways:
- From the article details page: to more easily compare links
- From the Heads Up Display (HUD): to put the information in visual context
From article details
To understand how links are performing:
- Open Compass view
- Click on an article to open its details page
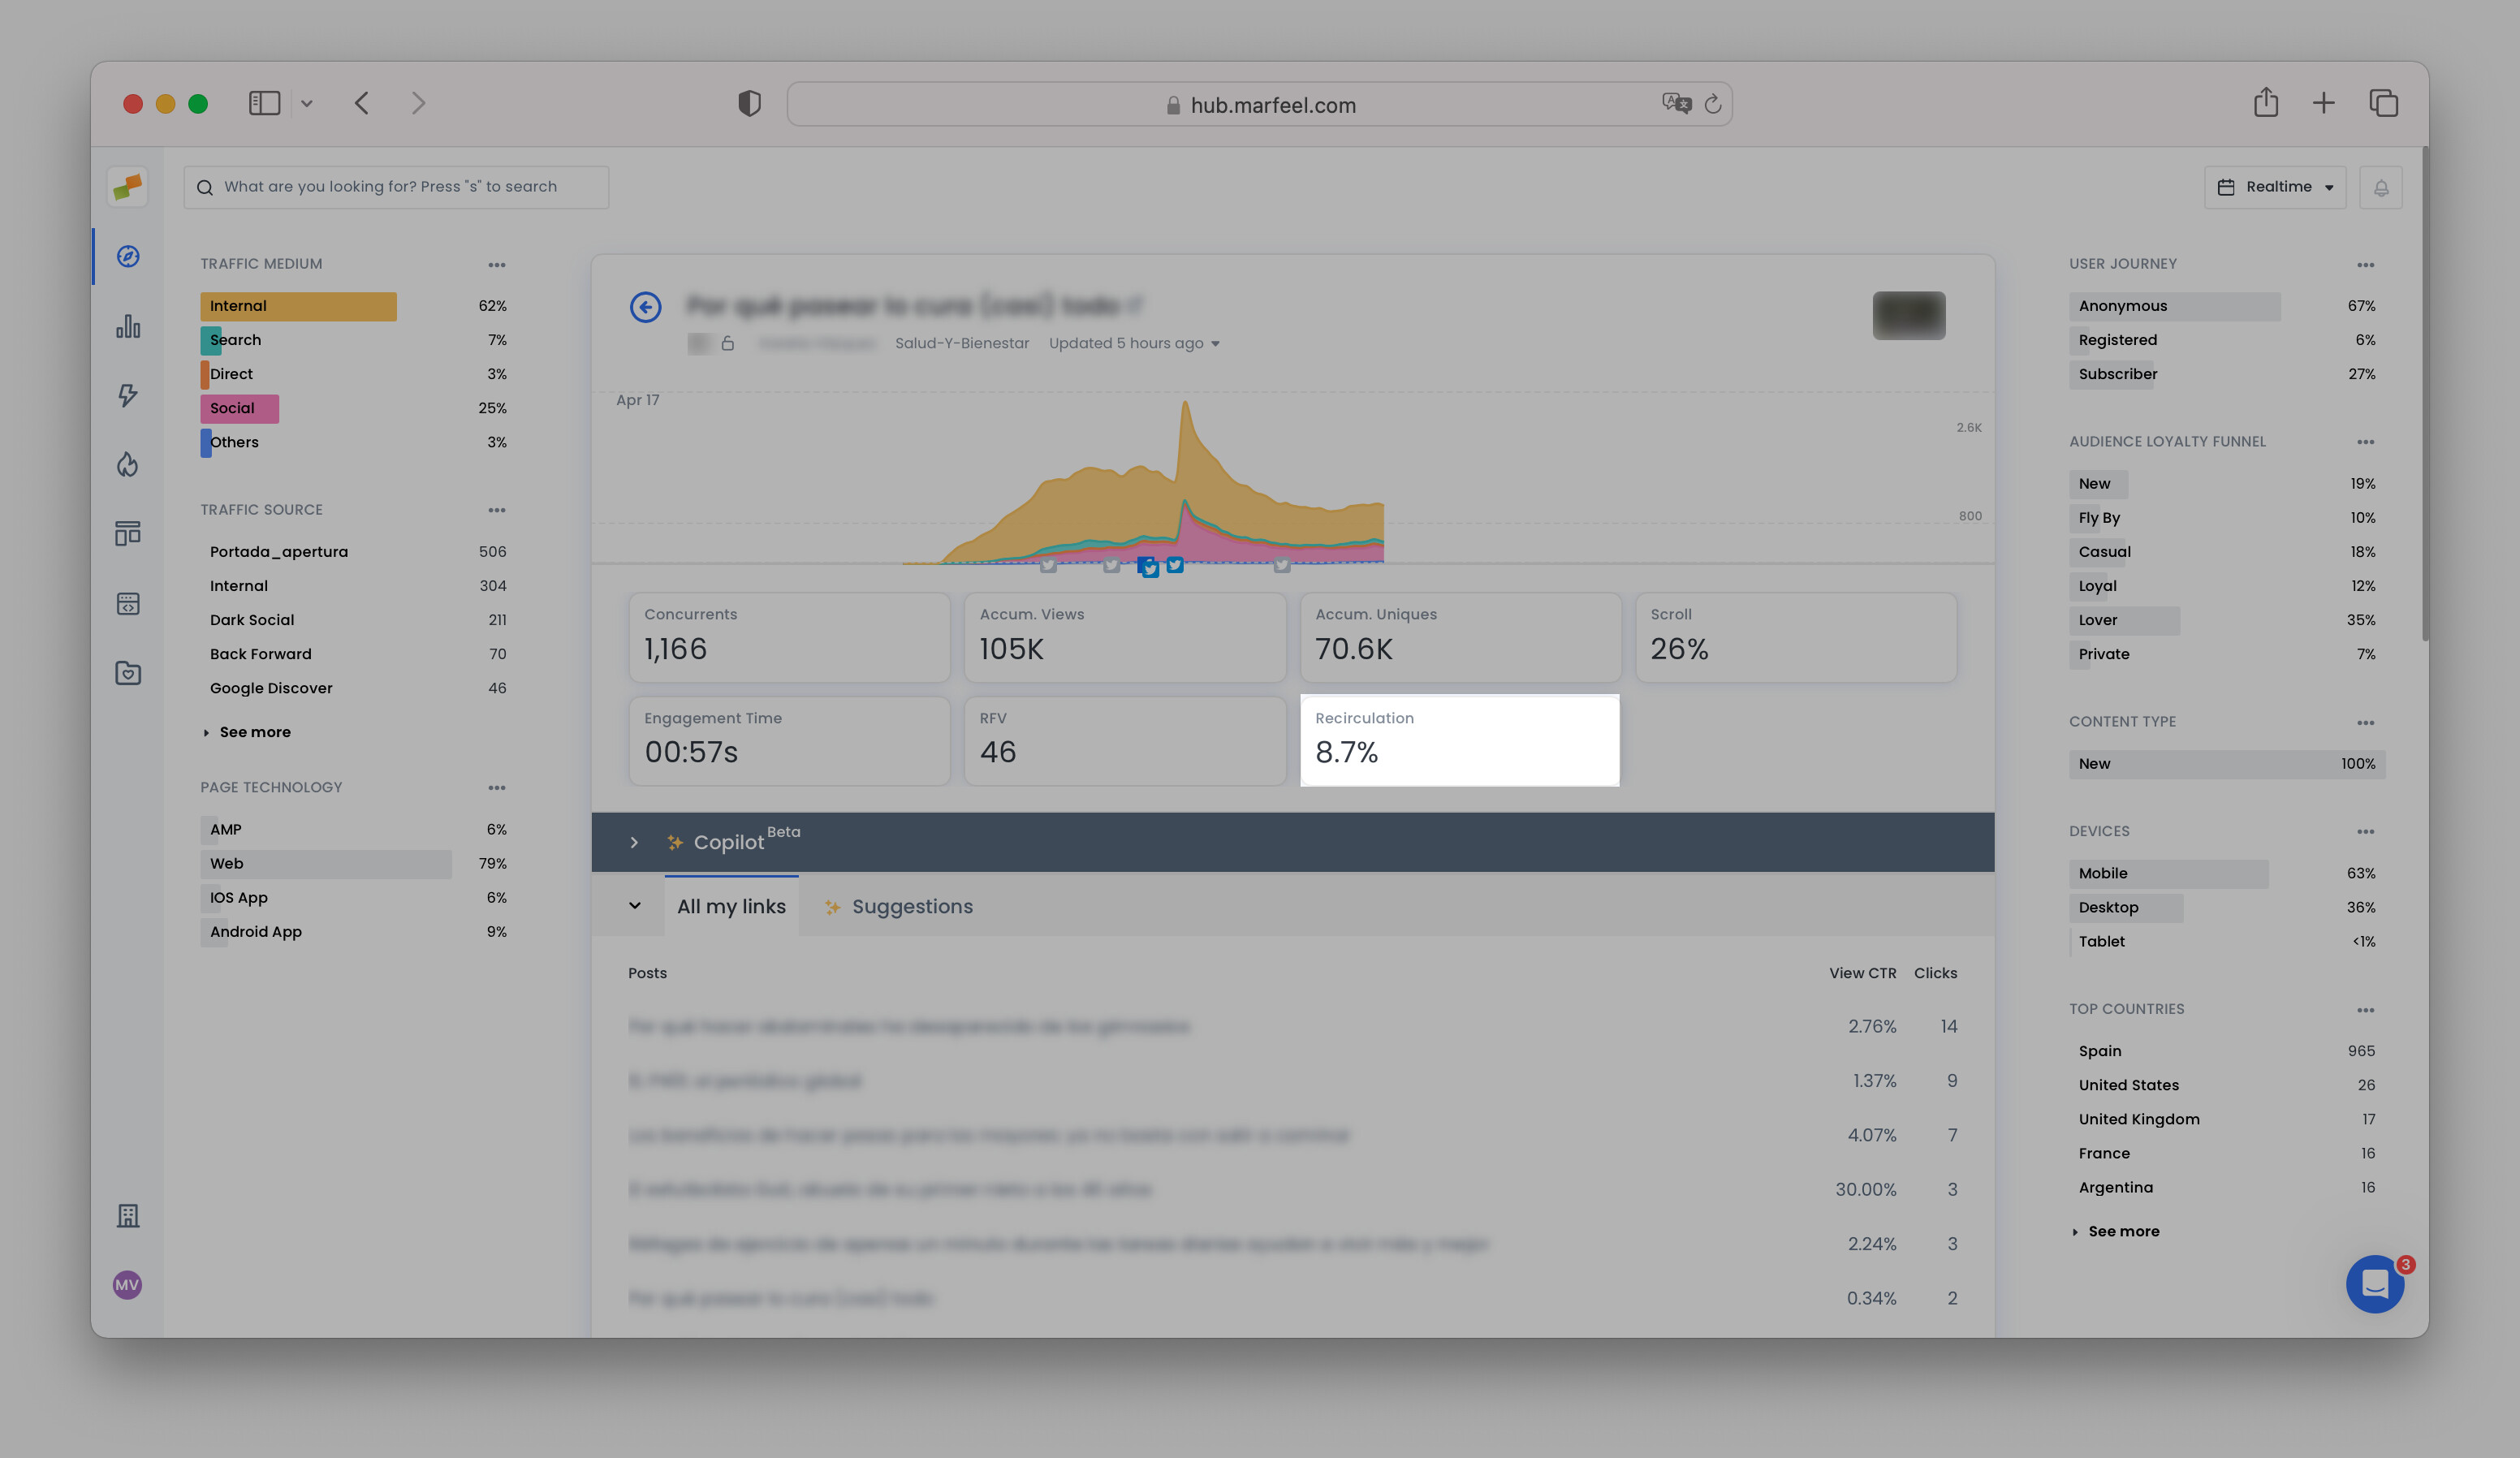
Recirculation rate
View the real-time recirculation rate of each post in the Compass article view, as above.
The Recirculation Rate is calculated by dividing the total number of clicks by the number of concurrent users. Recirculation rate is an important KPI indicating how interested readers are in what a publication has to offer.
A recirculation rate above 7% can be considered good.
Recirculation data is re-calculated from raw data even when applying filters.
On articles with little traffic or clicks, the recirculation data might fluctuate. Bear in mind that you can increase the time window to today or any date range you need.
Viewable CTR & Clicks
Under How are my links performing, you can see the list of internal and external URLs that are linked within the text of the article and elsewhere on the same page.
Monitor individual link performance for each URL in terms of the total number of Clicks and the Viewable CTR, which refers to the number of clicks on a link divided by the number of users who scroll far enough to see it (the number of times it enters the viewport). See full definition here.
More advanced users, such as those on Product and Analytics teams, can dive deeper in the Recirculation module.
How to use recirculation data
Ideally, content creators will follow up on the link performance of the articles they publish. This is critical for top of the funnel content aimed at traffic acquisition. High traffic acquisition articles need be optimized to recirculate, minimize bounce rate, and increase Internal traffic.
- If a link is not generating many clicks: Try changing the text of the backlink or replace it with an article getting a lot of engagement elsewhere on the site.
- If a link is generating LOTS of clicks: Consider adding it to other pieces where it makes sense to do so from an editorial perspective.
- If a link with a high Viewable CTR is located lower down on the page: Consider moving it up on the viewport to boost its performance. This works great for internal articles and affiliation links.
- Allow writers to gauge the interest of readers: Journalists often create links for their pieces, but they won’t know if those links are of any real interest to readers unless they see the recirculation data.
- Improve user loyalty: if users have nothing interesting to click on, they won’t read more content—a missed opportunity.
Once recirculation is optimized, publishers tend to see user engagement scores (RFV - Recency, Frequency, Volume) increase. RFV, in turn, is a highly predictive KPIs for subscriptions. The higher their RFV, the more likely readers are to subscribe. Better recirculation → more subscribers.
From the Heads Up Display (HUD)
It’s important to keep in mind that the HUD can be activated on any page of the domain, including article pages, where it has some very interesting applications, especially for recirculation and affiliation.
When you activate HUD on an article page, you can view article recirculation data from Compass in context. The HUD allows you to see internal link performance within the article itself in order to better understand why internal links are performing the way they are.
For example, say an article is gaining traction, and you want to make sure internal links are optimized in order to capitalize on the increase in traffic. Open up the article in Compass:
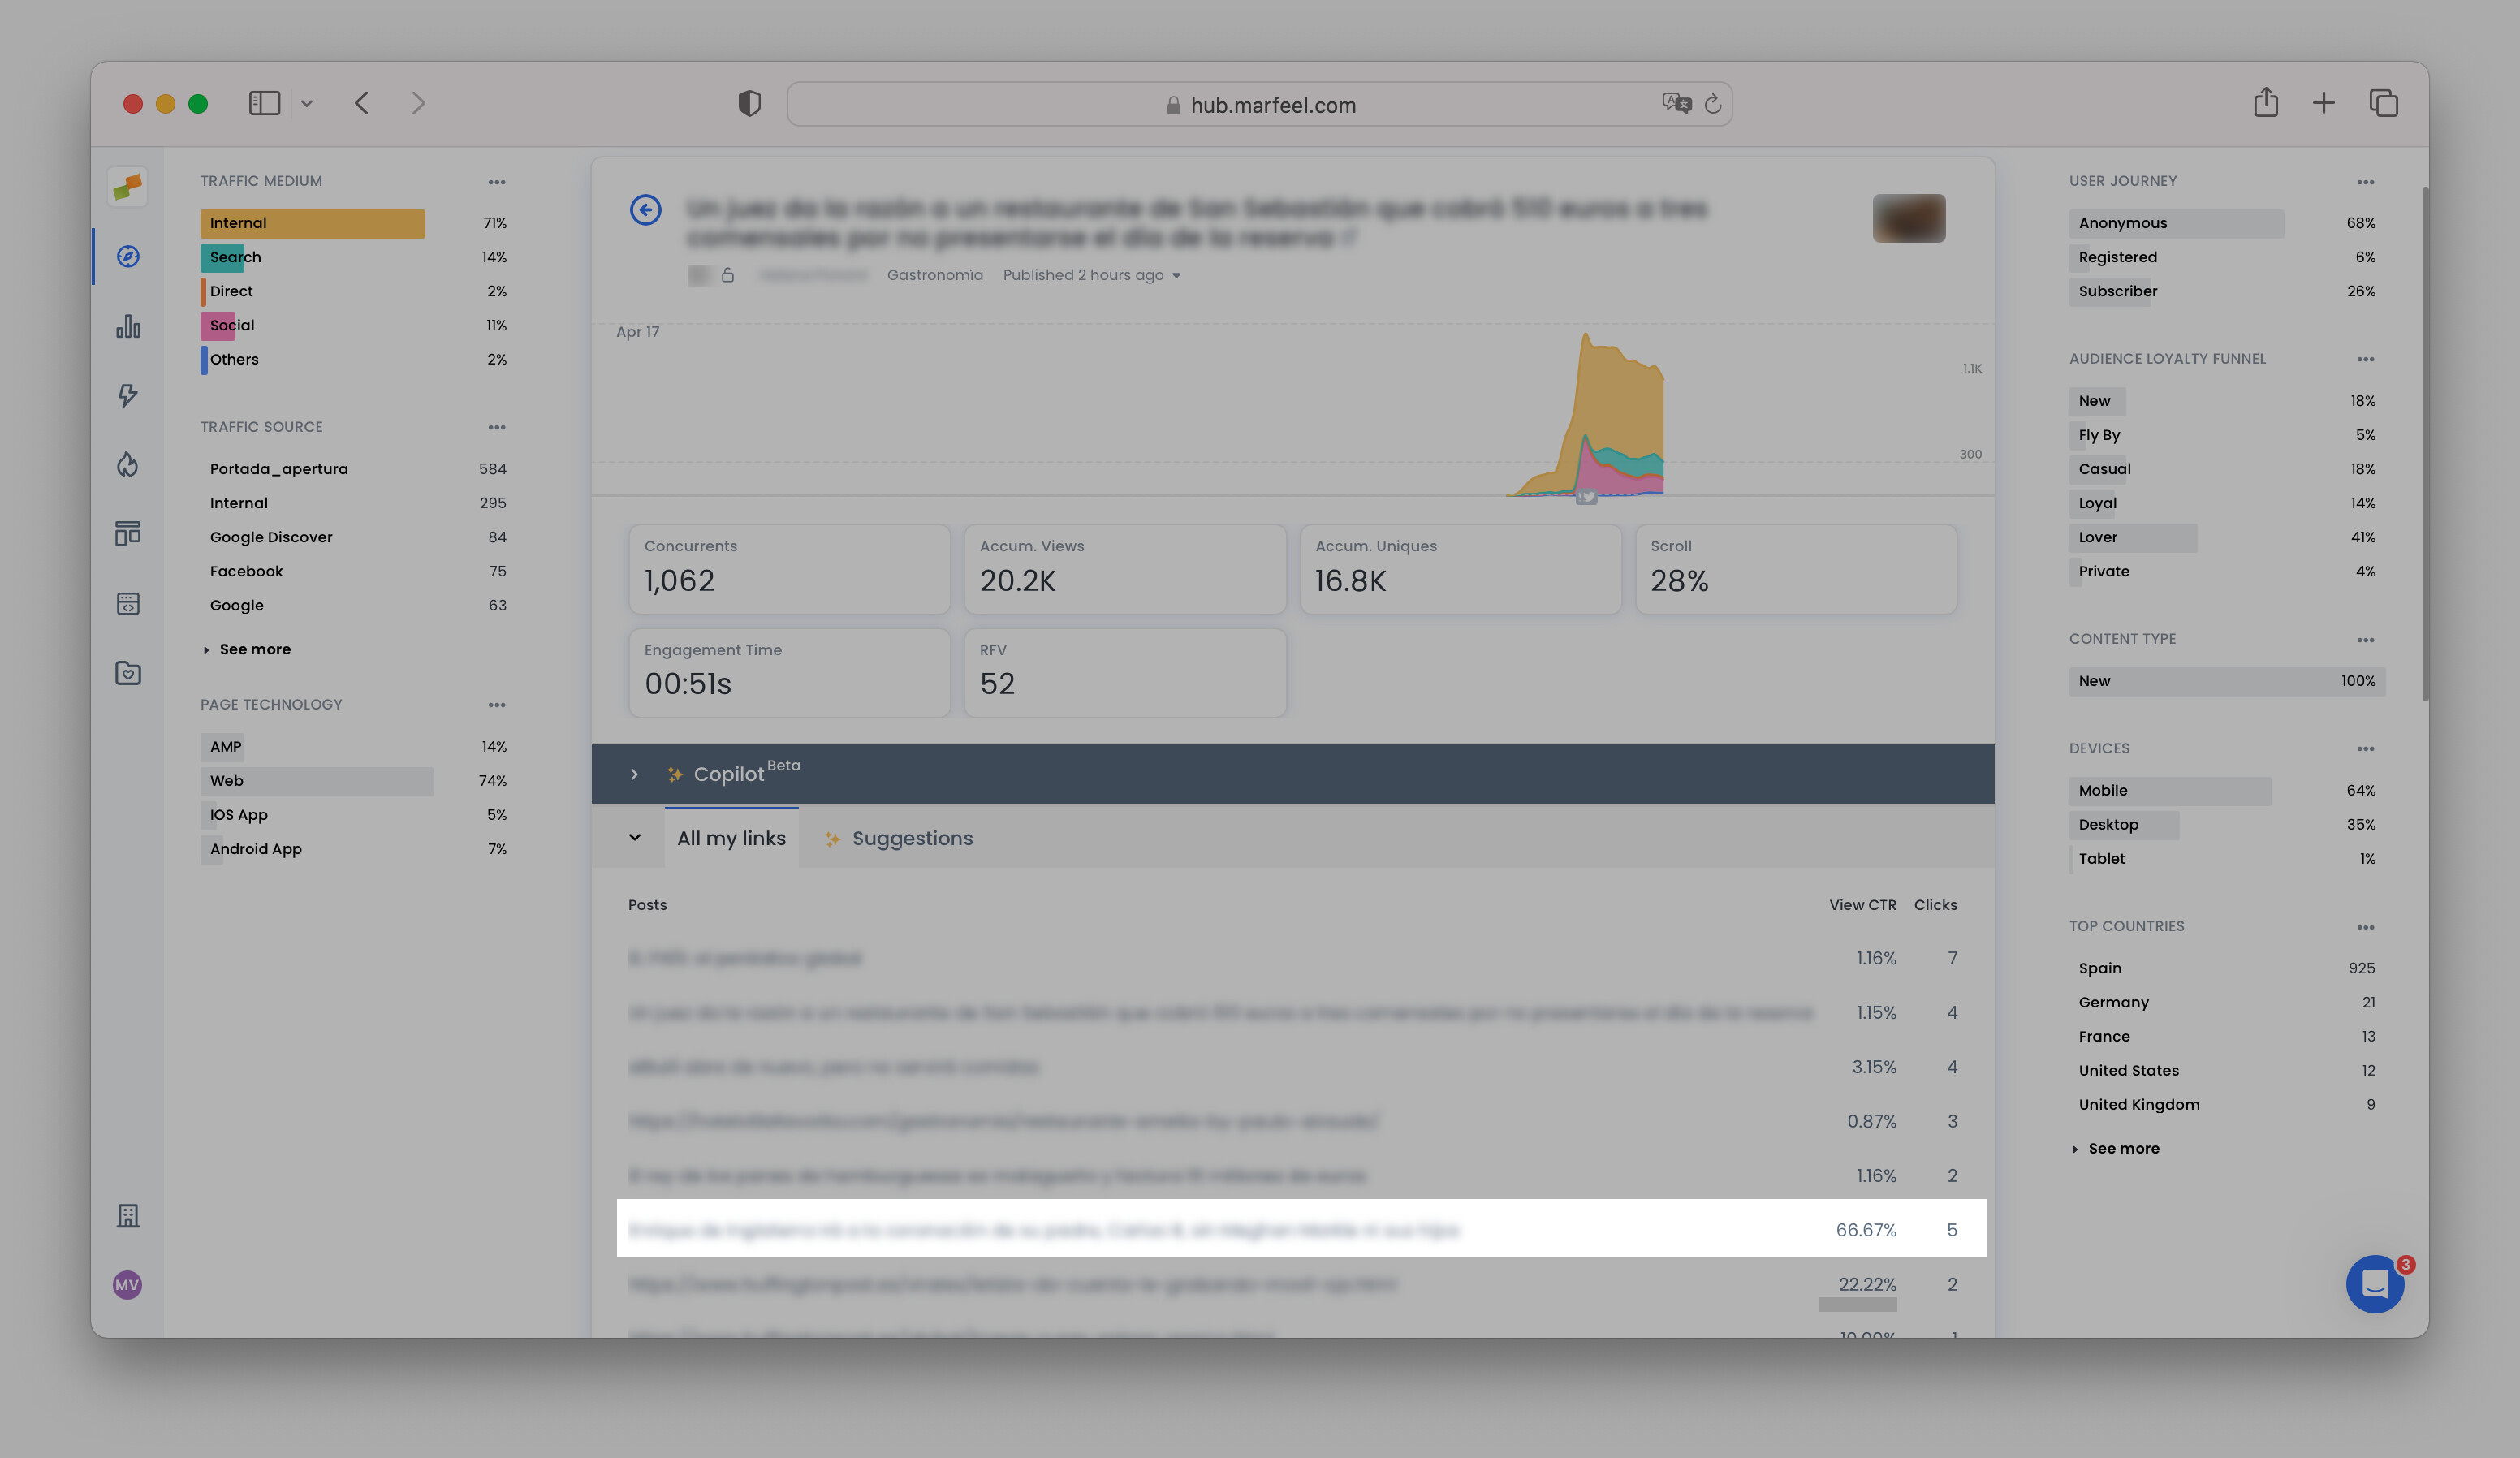
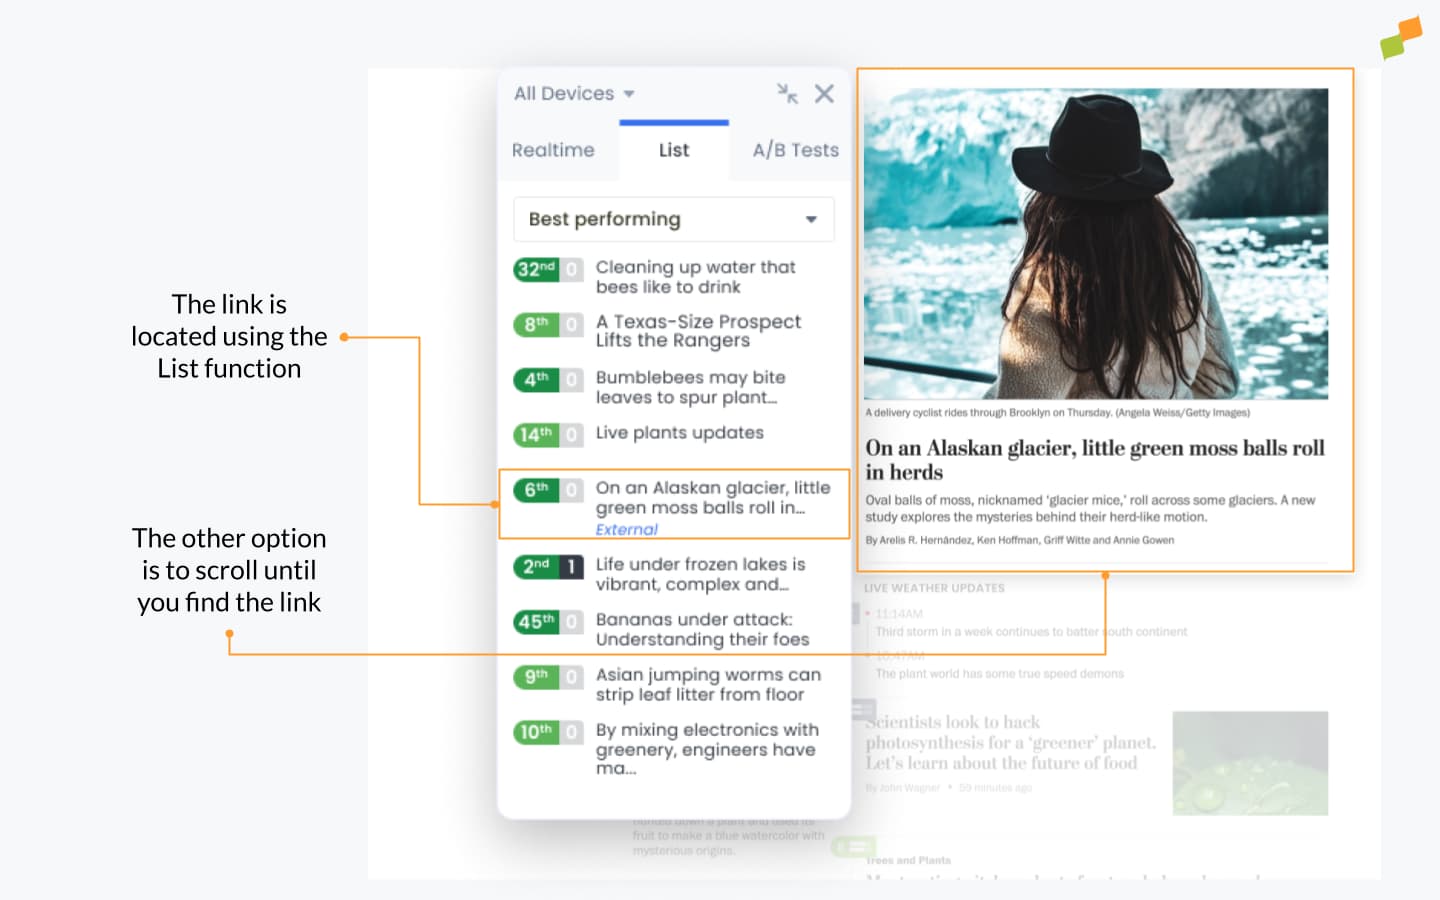
You see that the sixth link down has a high viewable CTR compared to other links, but relatively few clicks, meaning there is interest in the link among those who have seen it. However, you’ll need more visual context before you can decide on the best course of action. That’s where the HUD comes in.
Open the article —the HUD should overlay automatically if it’s already activated. You can locate the link using the List function in the HUD toolbox or simply scroll until you find it. Now you can see the link in its native habitat.
Now it’s an editorial decision whether or not to:
- Move the link higher up the page or increase its visibility in some other way.
- Move underperforming links down the page or run an A/B test to find out if it’s possible to increase their impact.
Affiliation
Find real-time data for affiliate links in the article details in Compass to determine if there are any opportunities for optimization. If so, open the article with the HUD overlay activated in order to view the links in context.
For example, for an article about the top 10 hair products on Amazon, let’s say product #8 has a high viewable CTR but relatively few clicks. You open the article with the HUD overlay activated to view the links in context, and see that product #8 is near the bottom of the page. Based on the viewable CTR that a high percentage of readers who scroll far enough down the page to see it will end up clicking on the affiliate link.
Depending on the context, this might be an opportunity to change the order in which the products are reviewed to increase the visibility of the link with greater potential to send traffic to Amazon. By cross-referencing the scroll percentage in the HUD toolbox, you can see how far down most people scroll and make sure that the popular product is placed above that cut-off point.