The Recirculation view is a one-stop-shop for internal traffic insights. Recirculated readers represents a highly engaged and valuable part of your funnel: these are users who came to your site for one piece of content, but have stayed for another. They do a lot of heavy lifting in terms of pageviews, SEO, and conversion.
The reports available from Recirculation Insights are key to increasing internal traffic and improving overall performance. Use it to find out how individual links, Flowcards and modules are performing and suss out opportunities.
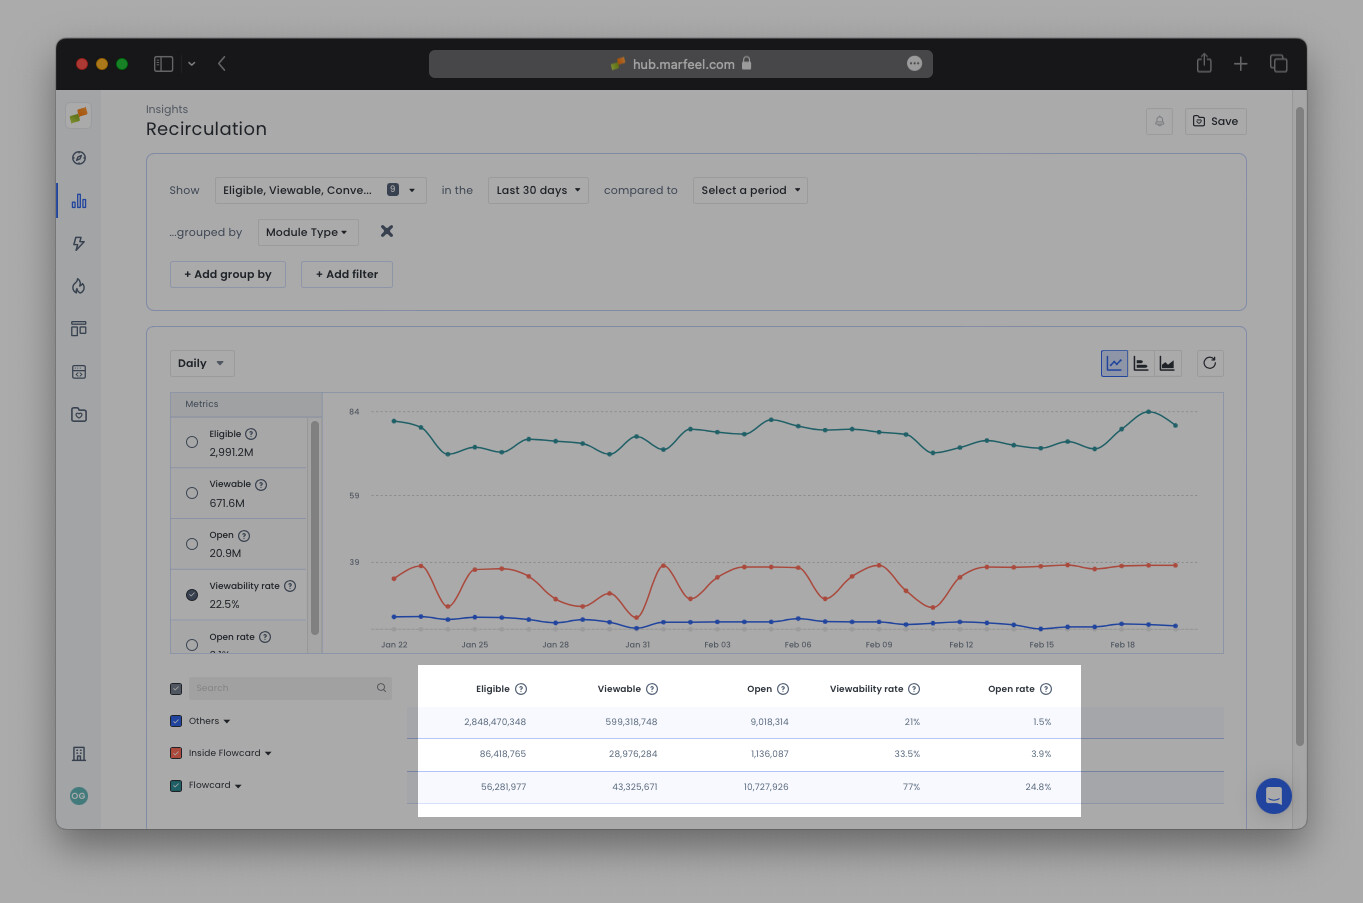
Metrics by module type
The Recirculation Insights metrics vary depending on the module type
How are my modules performing?
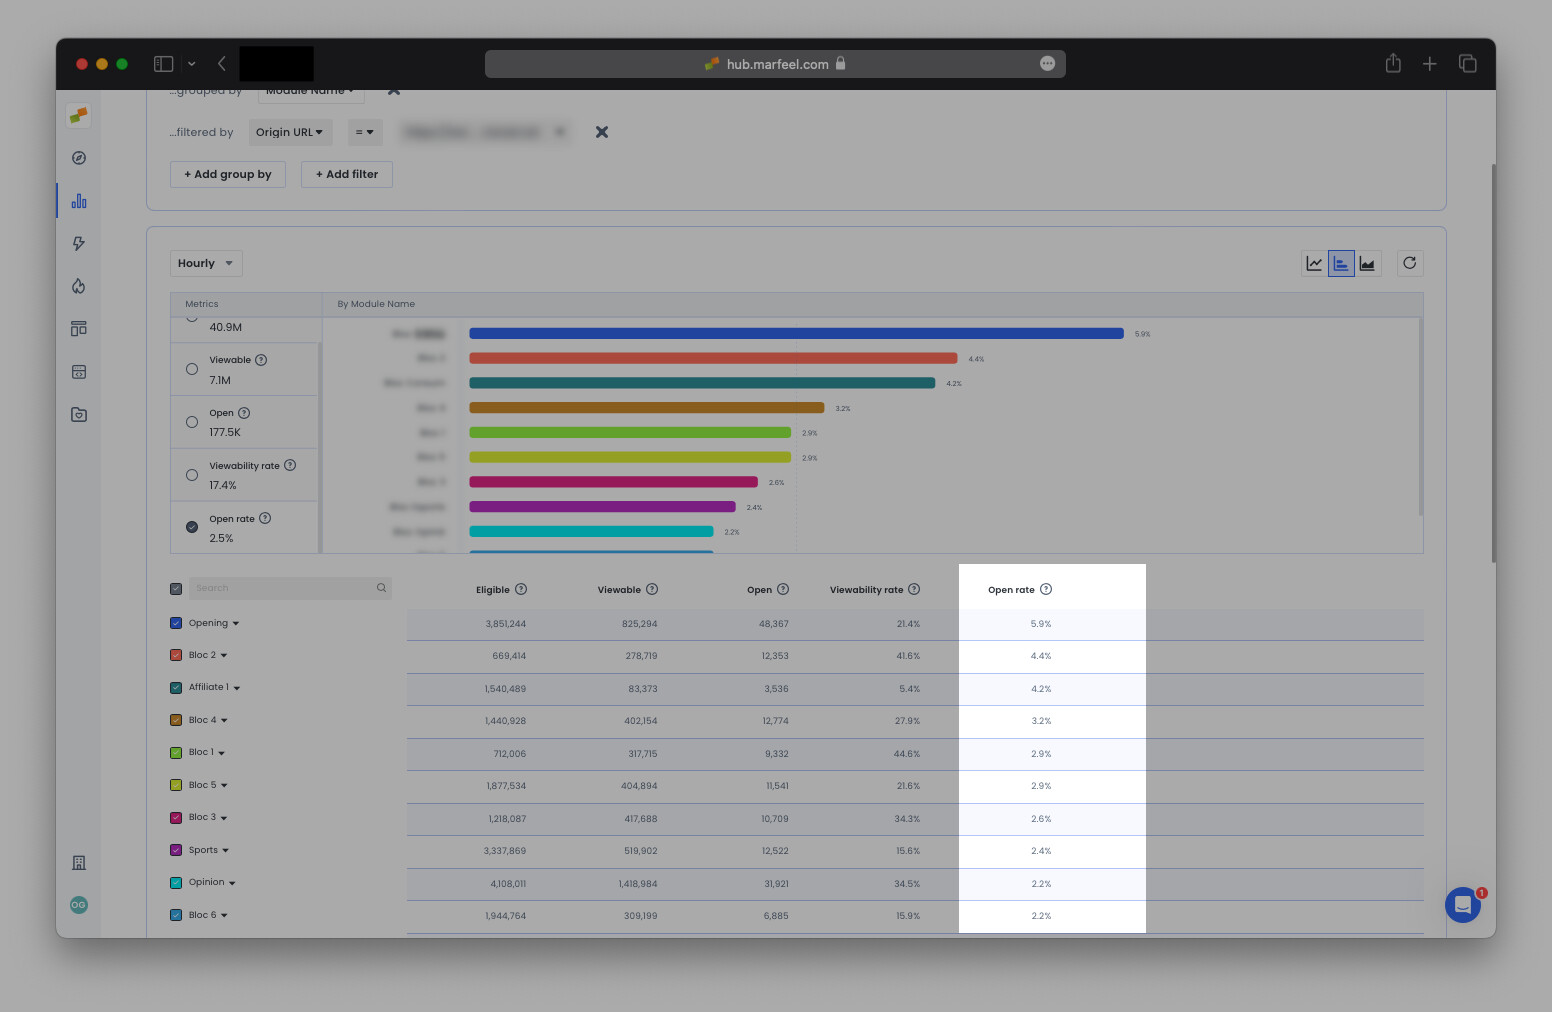
Group by Module name to view individual performance of by module and see which modules are generating the most recirculated traffic. In the example below, the recirculation data is filtered by Origin Content type to show modules in editorial content, eliminating those on the home or section pages.
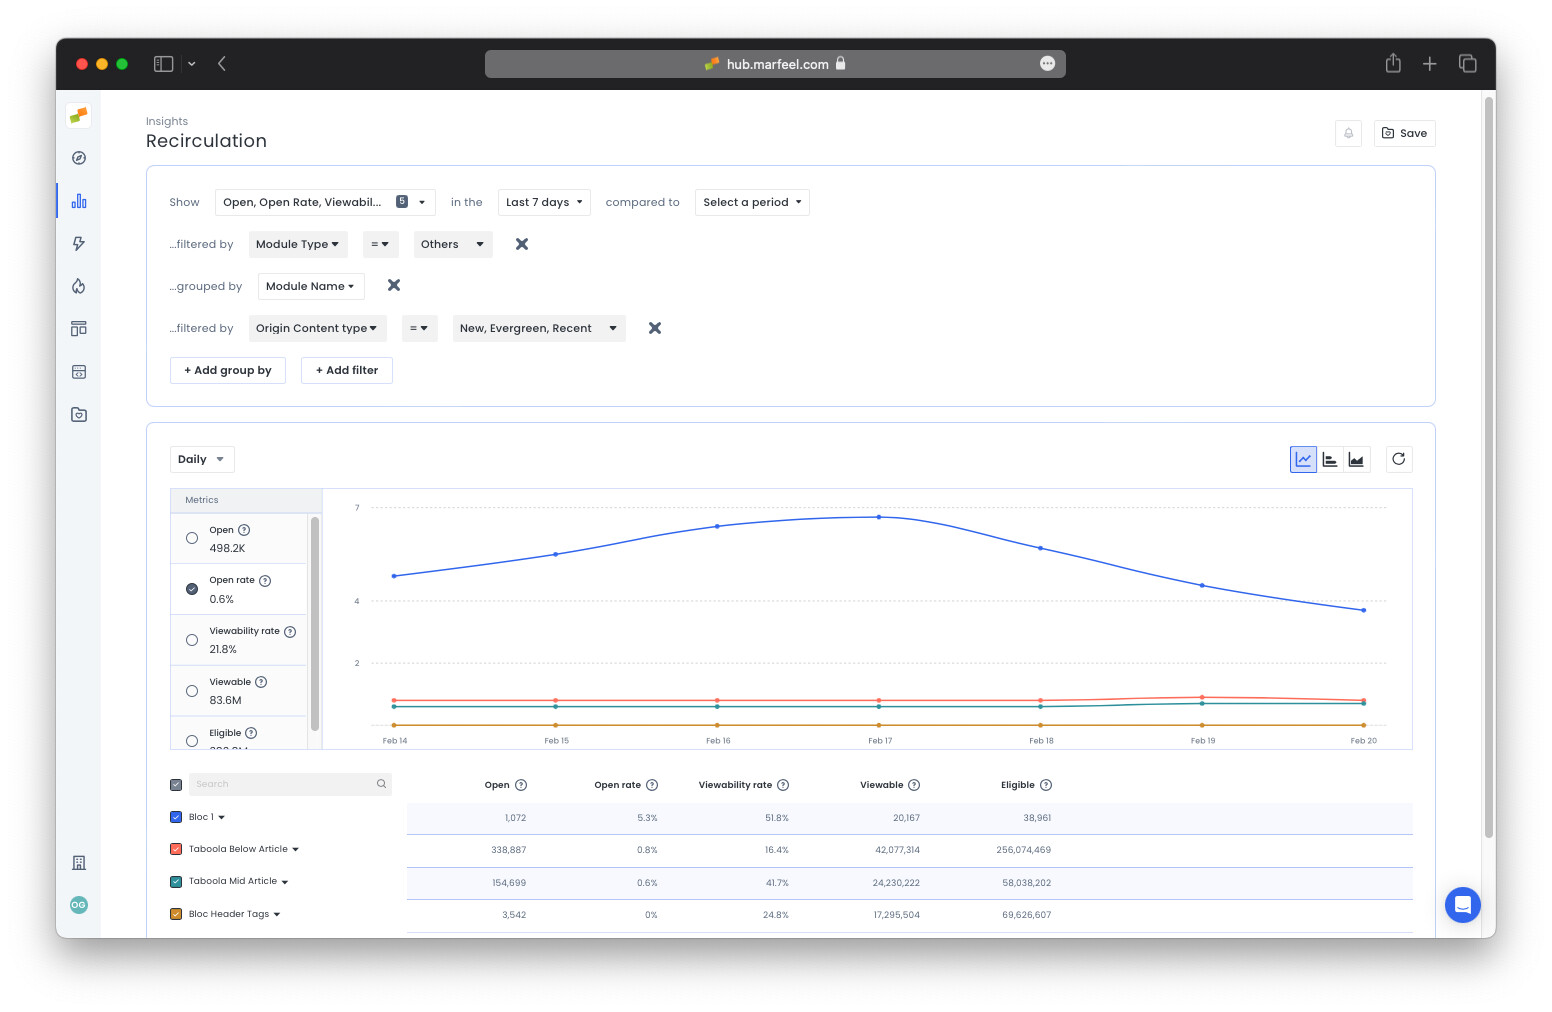
Module name can be specific to a page, such as Home page Opening or be featured across several pages, such as Taboola Below Article in the example above, Most Read, Latest News Sidebar, etcetera.
Does position inside the module affect performance?
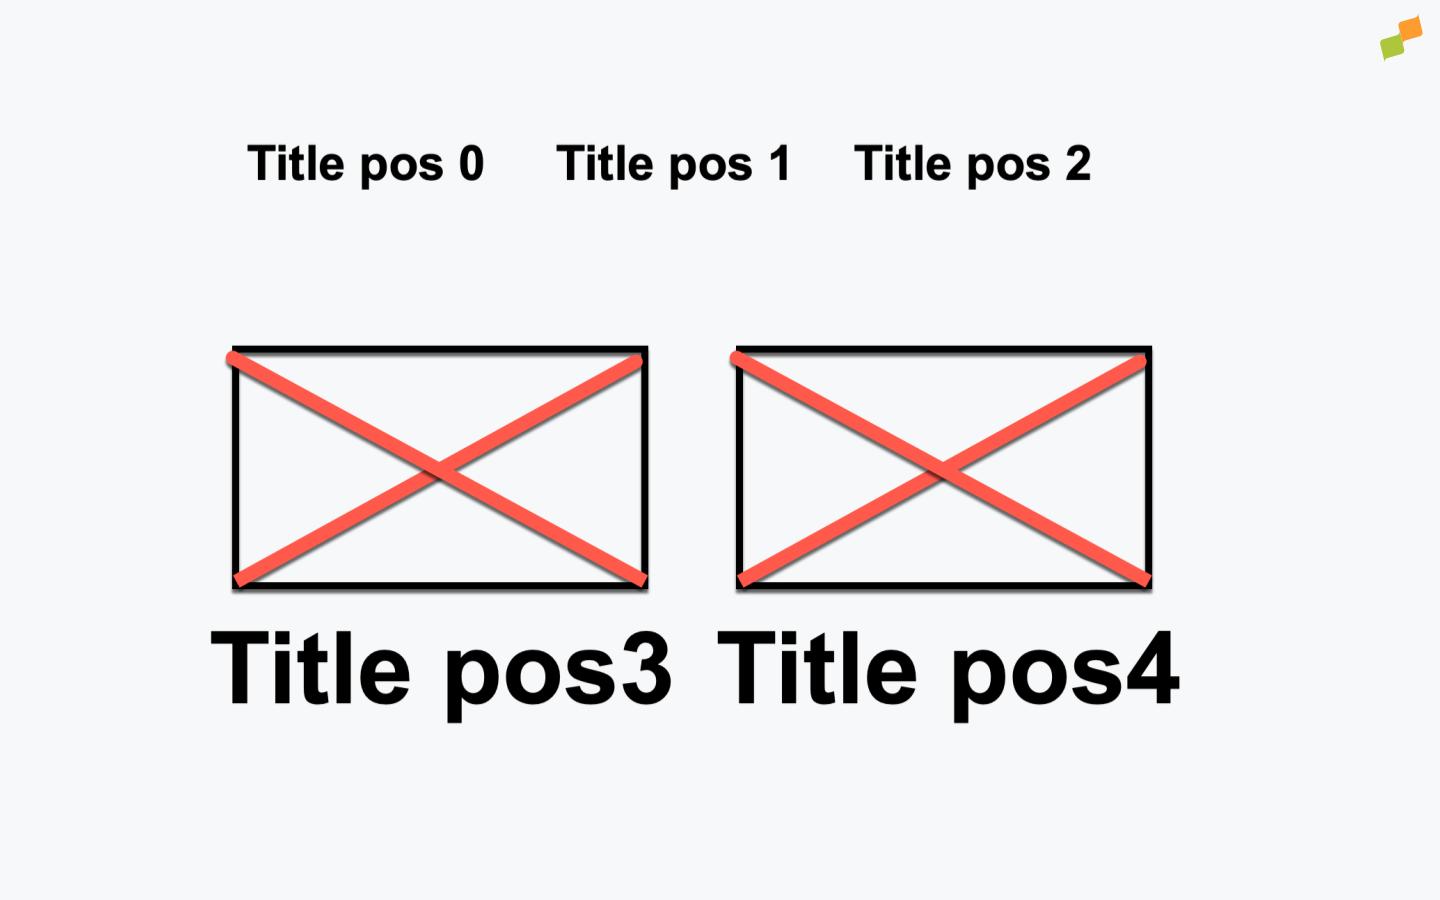
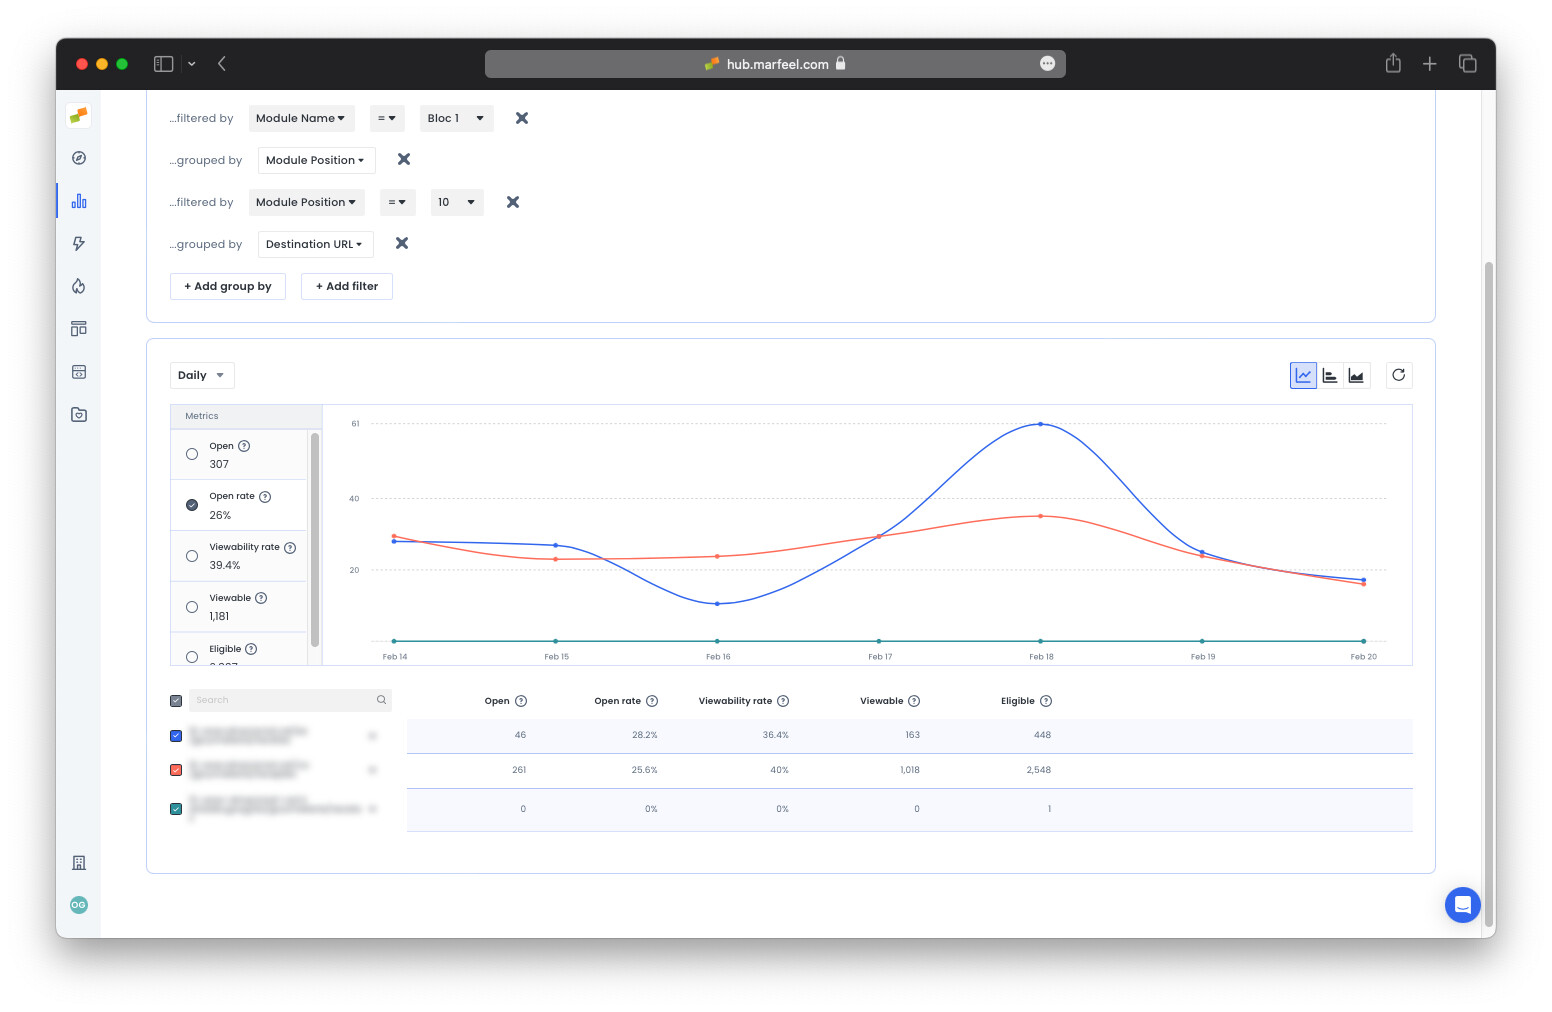
Many modules draw attention to certain articles with a larger font size or image. Use the Module position dimension to find opportunities to reorder links within a given module. Module position refers to the order in which links appear in the module. Position 0 is the first link that appears in the viewport, followed by 1, 2, 3, etc.
In the example showing Module names above, one module is outperforming the rest in terms of Open rate with open / viewable = 5.3%. Drilling down further by module position shows where in the module the clicks are coming from.
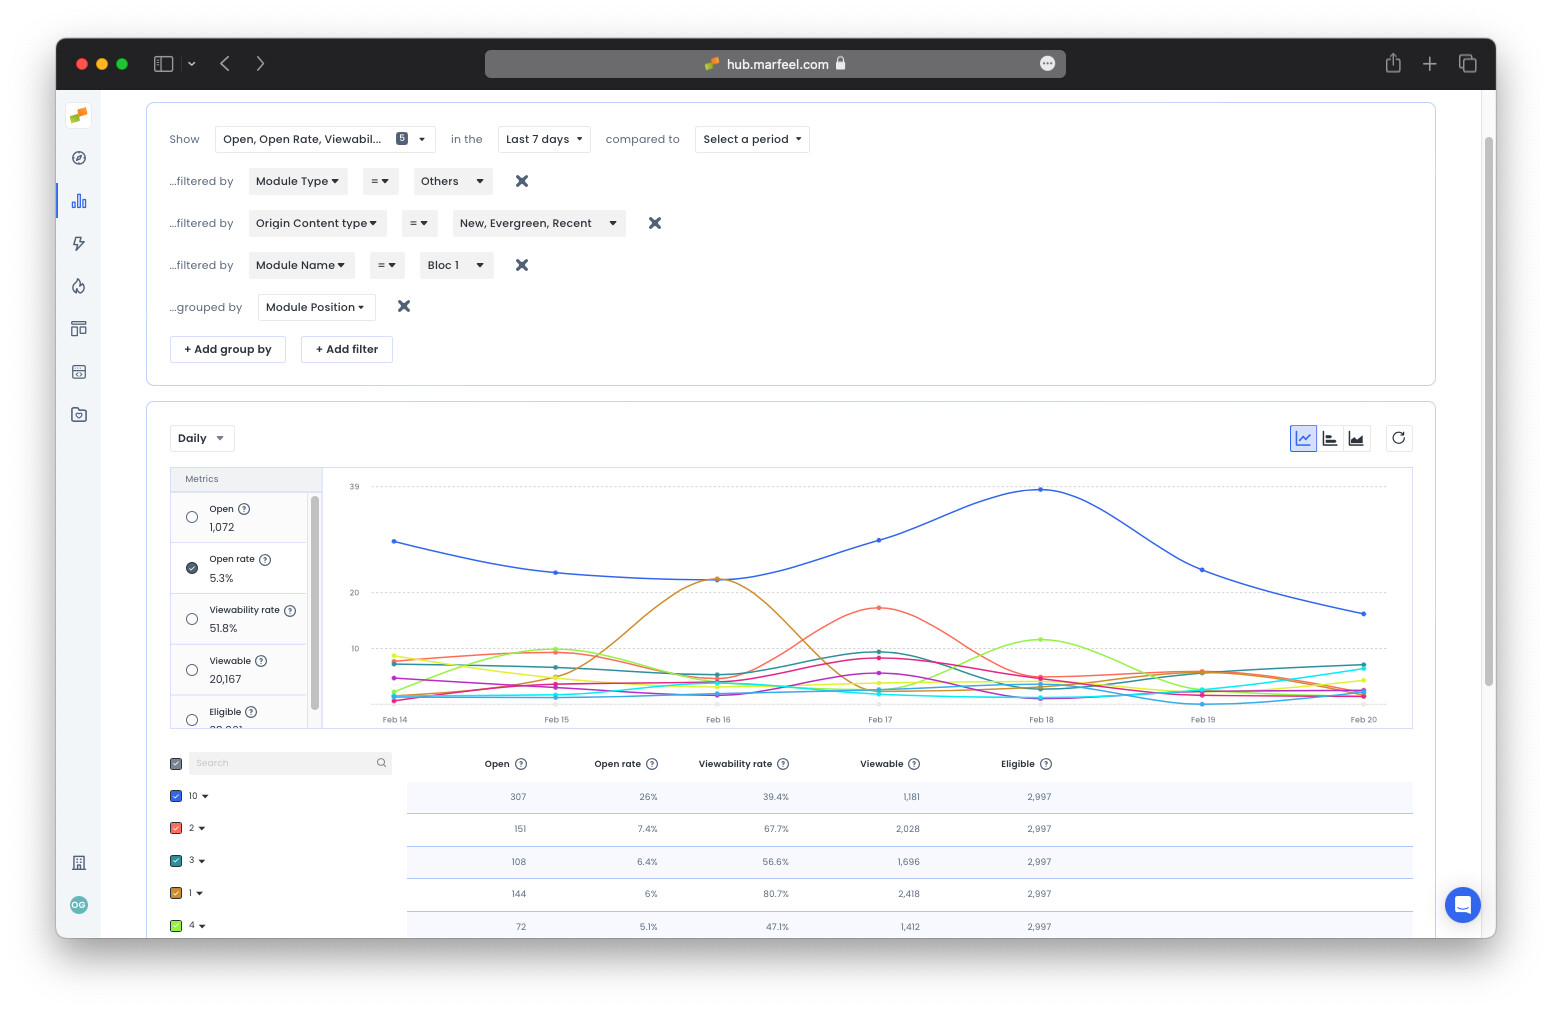
In this particular module, we can see that the 10th position has the highest open rate.
Note that Eligible is the same for every position, as that indicates the number of times a page with the module has been accessed, and does not consider the positioning within the module. On the other hand, Viewable does vary because the entire module is not entering the viewport each time.
In fact, despite the fact that the 10th position is viewed considerably less than numbers 0-2, it still has the highest number of Opens and, naturally, the highest open rate—by a substantial margin. Looking at this module in context might reveal that the 10th position is privileged in some way with a larger font or image. However, the lower visibility indicates this is unlikely.
It could be a good idea then, if it makes sense from an editorial perspective, to move the link in the 10th position higher up in the module, or even to a module on the home page to further boost visibility. Filter by the 10th position and dill down by Destination URL to see the links that have been performing so well in this position:
Use Cases: Actionable Insights from the Recirculation View
Which modules on my homepage are underperforming?
To see your homepage modules in action, drill down by Module name filtered by Origin URL = homepage URL in Real time. Low open rates indicate that modules are not recirculating readers. Compare them to the modules with the highest open rates for context:
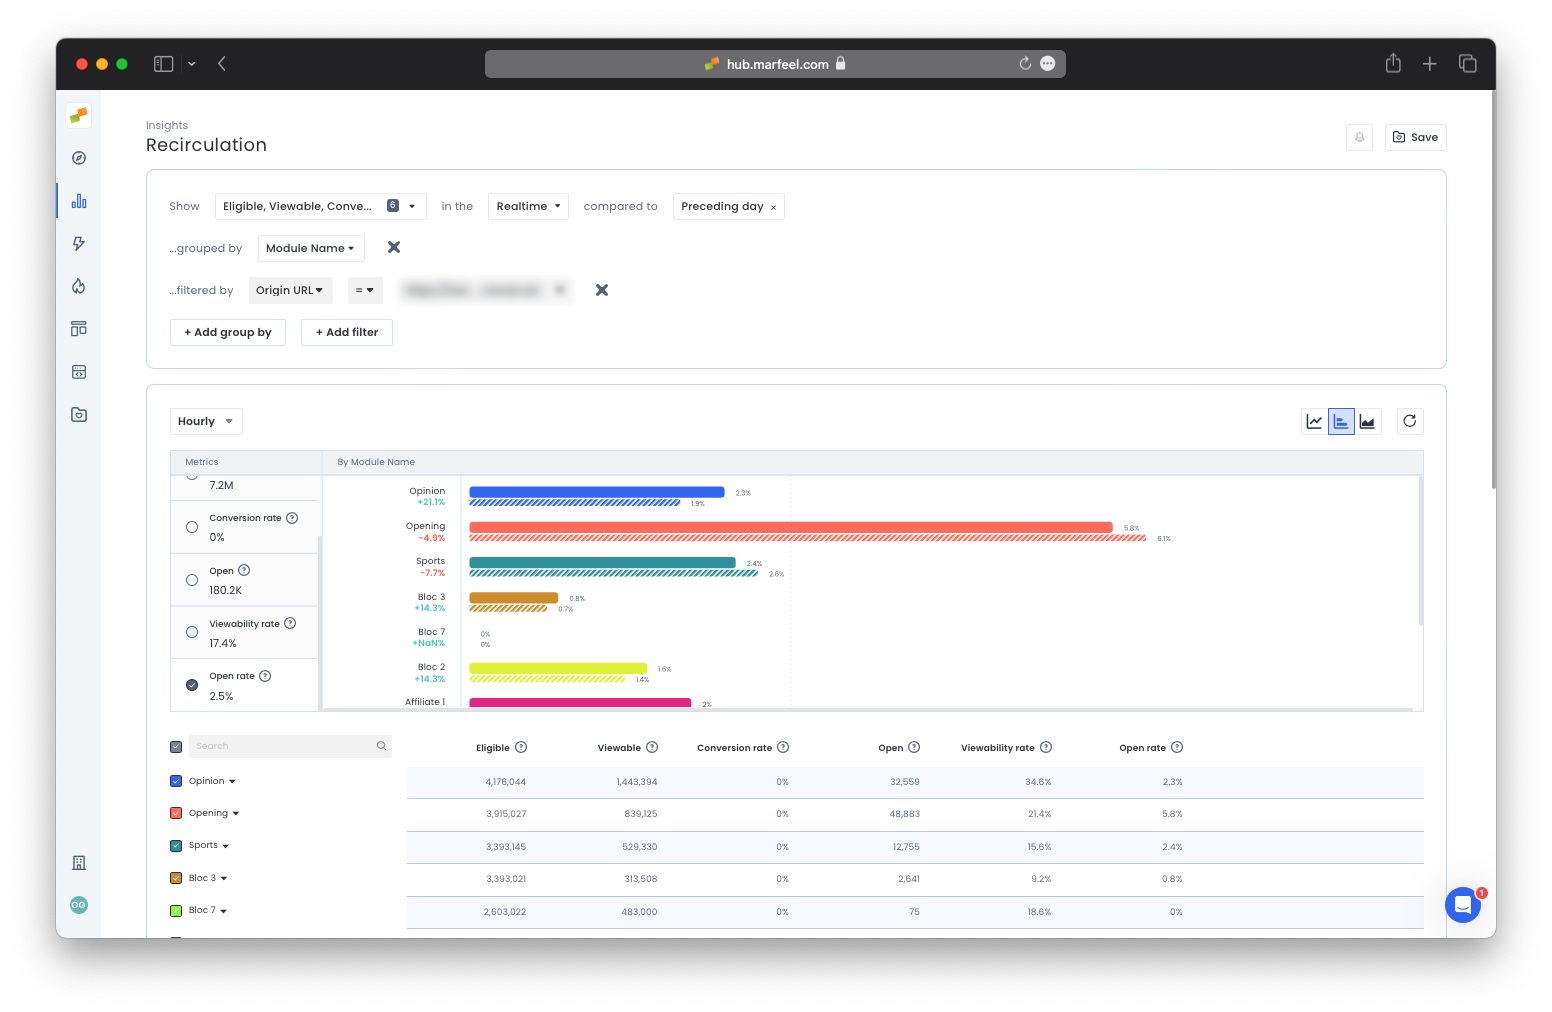
How are my homepage modules doing compared to yesterday?
Compare real-time results to yesterday’s performance to see where engagement is lagging:
How can I increase engagement with opinion pieces via the homepage?
Perhaps you’ve noticed that recirculation from the opinion module on the homepage is low and readership of opinion pieces is down as a result. What might be the cause?
Theory #1: The opinion module lacks visibility on one or all device types
Query: Viewability rate during the Last 30 days grouped by Device category filtered by Module name = Opinion and Origin URL = homepage.
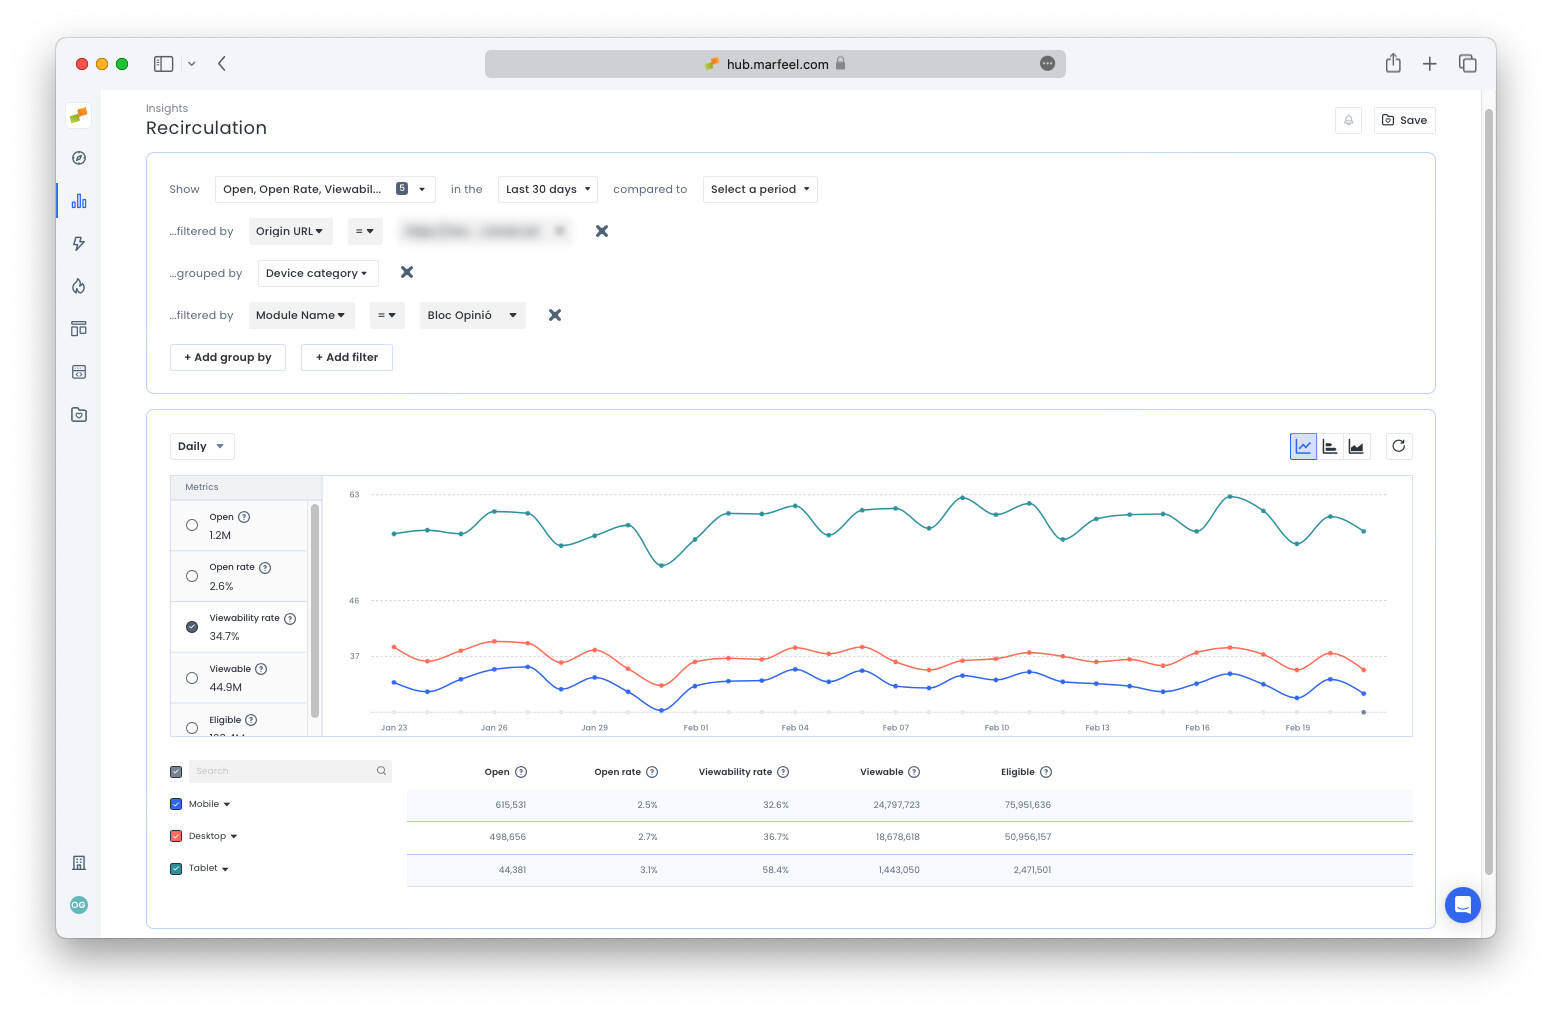
In the example above, there isn’t a remarkable difference between desktop and mobile, however there might be an opportunity to move the module into a more viewable position on mobile. It would also be interesting to see where the module is located on the tablet view in order to see if it offered any ideas for how to increase the visibility on the other two device types.
Theory #2: Opinion pieces are generally long-form, qualitative articles written by experts. Does the writing style or reputation of certain authors generate more interest in this type of content?
Query: Open rate during the Last 30 days grouped by Author name filtered by Module name = Opinion and Origin URL = homepage.
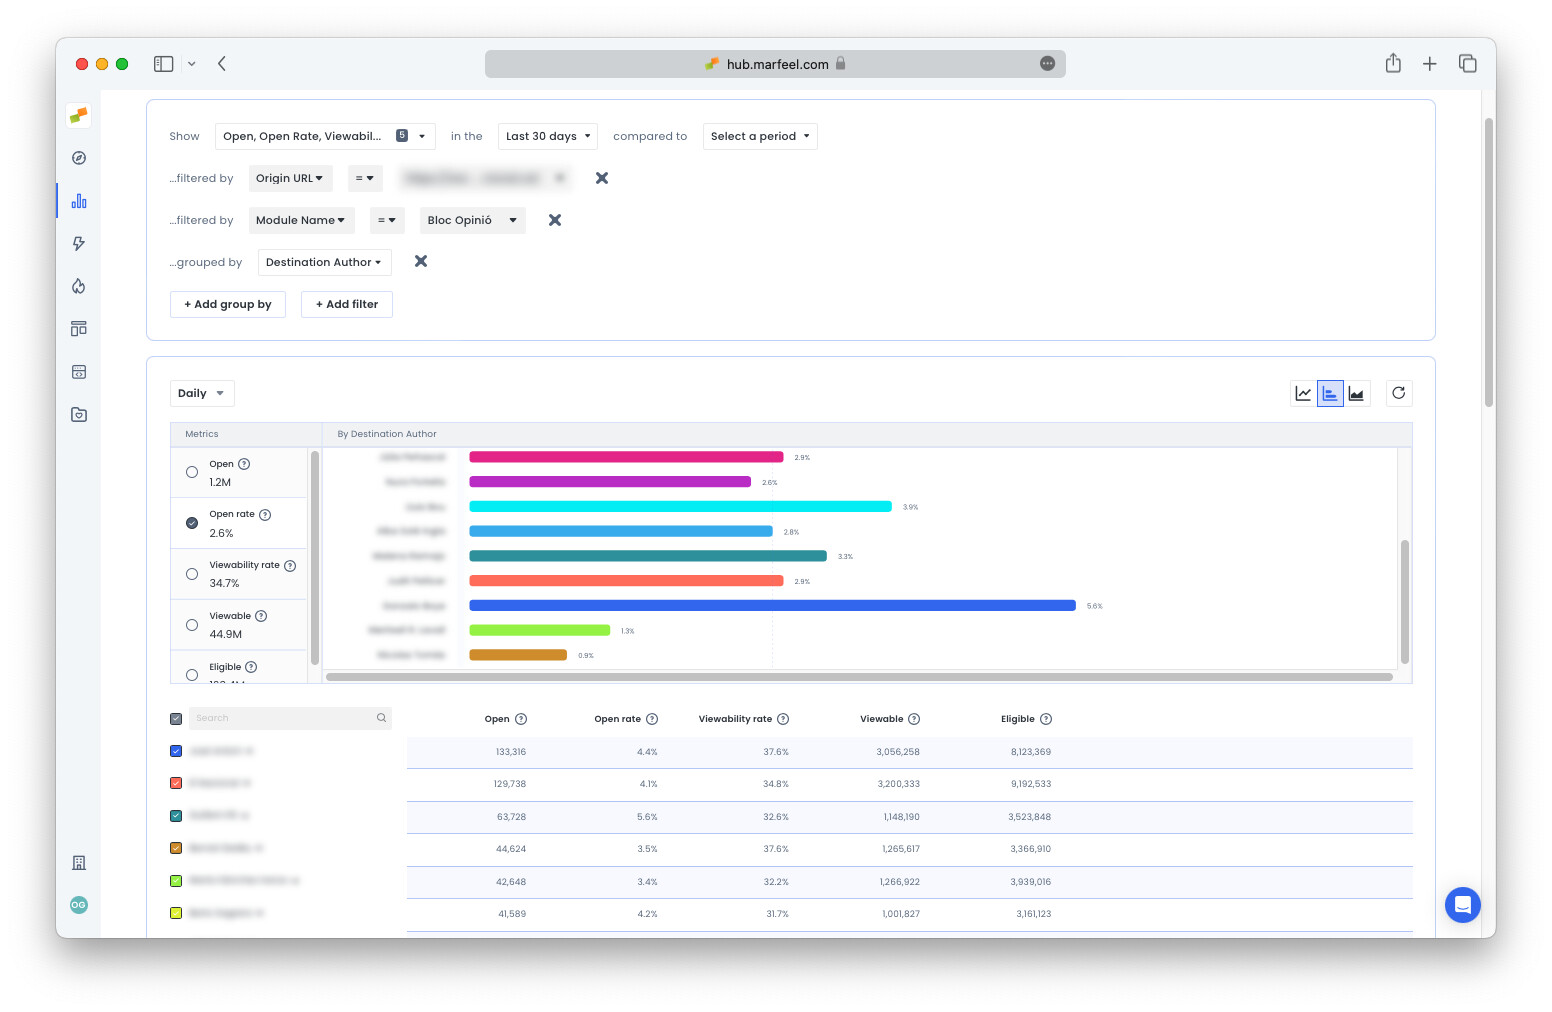
In the example above, certain authors have open rates up to 5x that of other authors (names have been blurred). More articles by these “heavy hitters” could increase readership of opinion pieces featured on the homepage.
Theory #3: There are likely some subjects that work better for long-form think pieces than others. Does the topic influence open rates in the opinion module? Repeat the query above, swapping out the author filter for Destination topic or Destination tag.
Which links should be featured on the homepage?
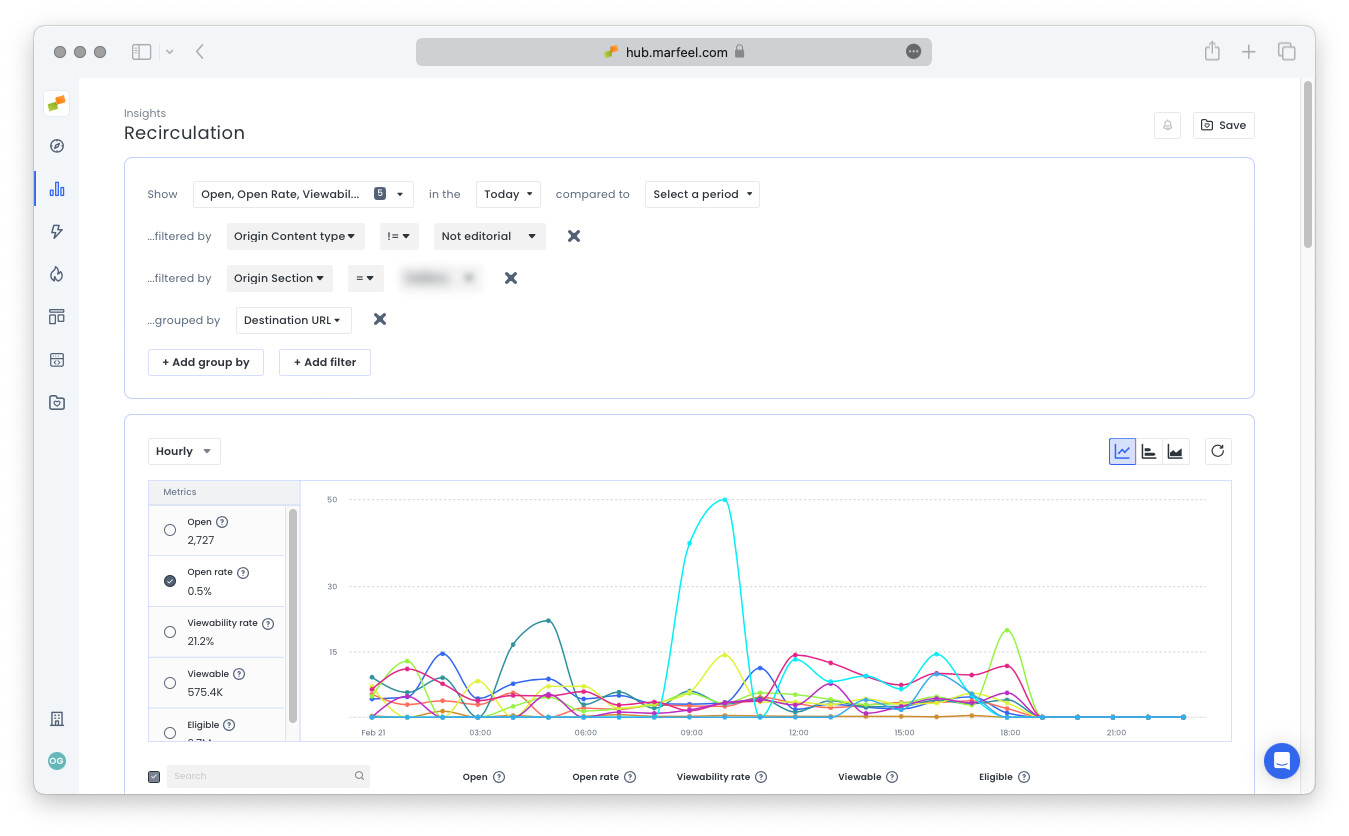
Are there links in your section that are generating a lot of internal traffic without even being on the home page? Filter out Not editorial Origin content types to only see links that are hosted in modules that are not on the home page and section pages. Drill down by Section to focus your search and by Destination URL see which URLs are gaining traction.
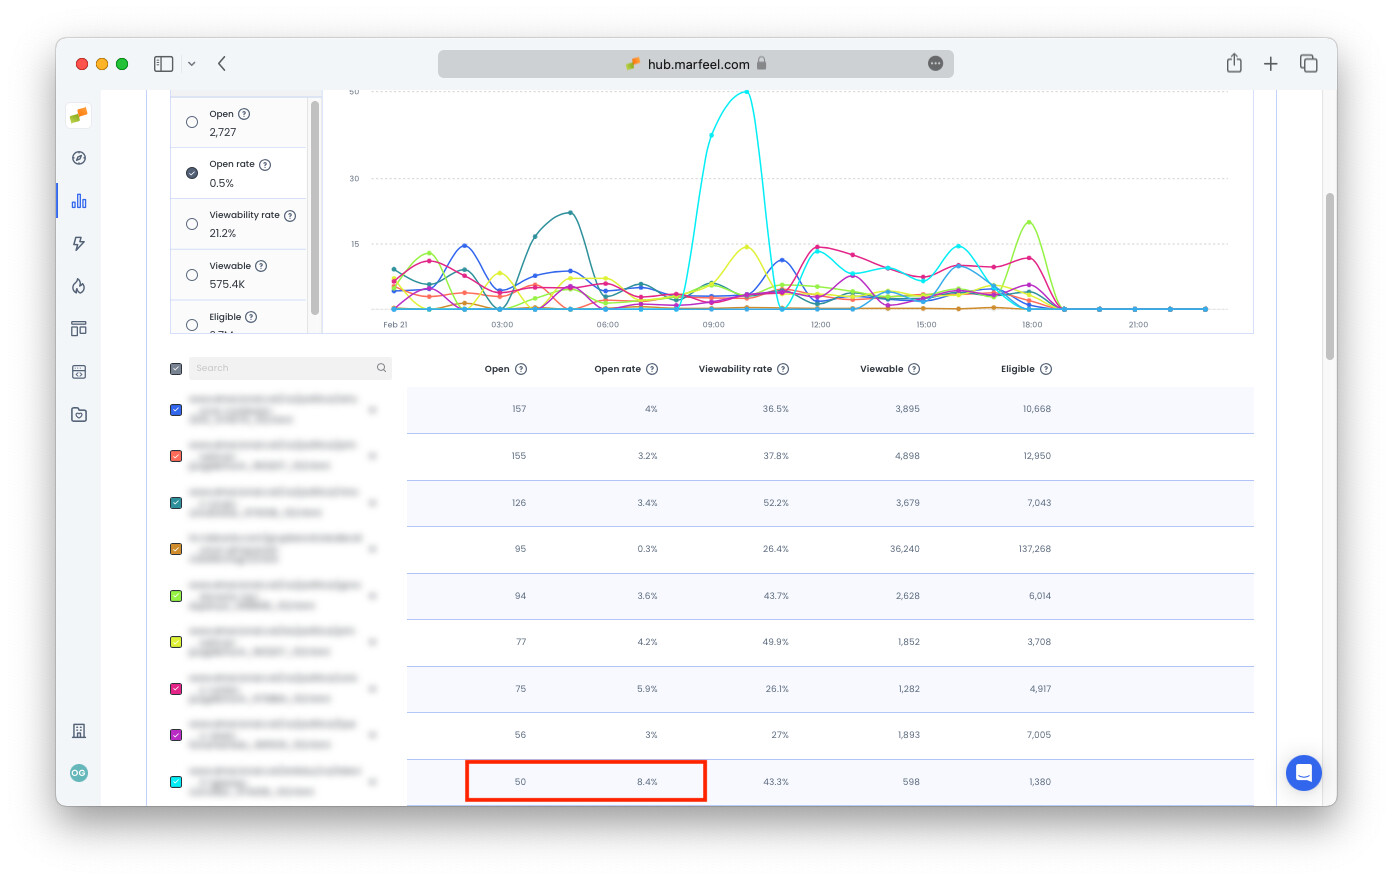
In this case, it might make sense to feature this content on the homepage or even to include it in a social media post, in this way increasing the visibility of content that has already proven to be of interest to readers.
How can I increase recirculation to branded content?
Find out which modules within which sections send the most viewers to branded content. In the example below, the publisher has a domain dedicated to branded content. The following query will reveal which modules on which section have the highest open rates for branded content:
Query: Open rate during the Last 30 days filtered by Origin host = main domain and Destination host = branded domain grouped by Origin section and Module name.
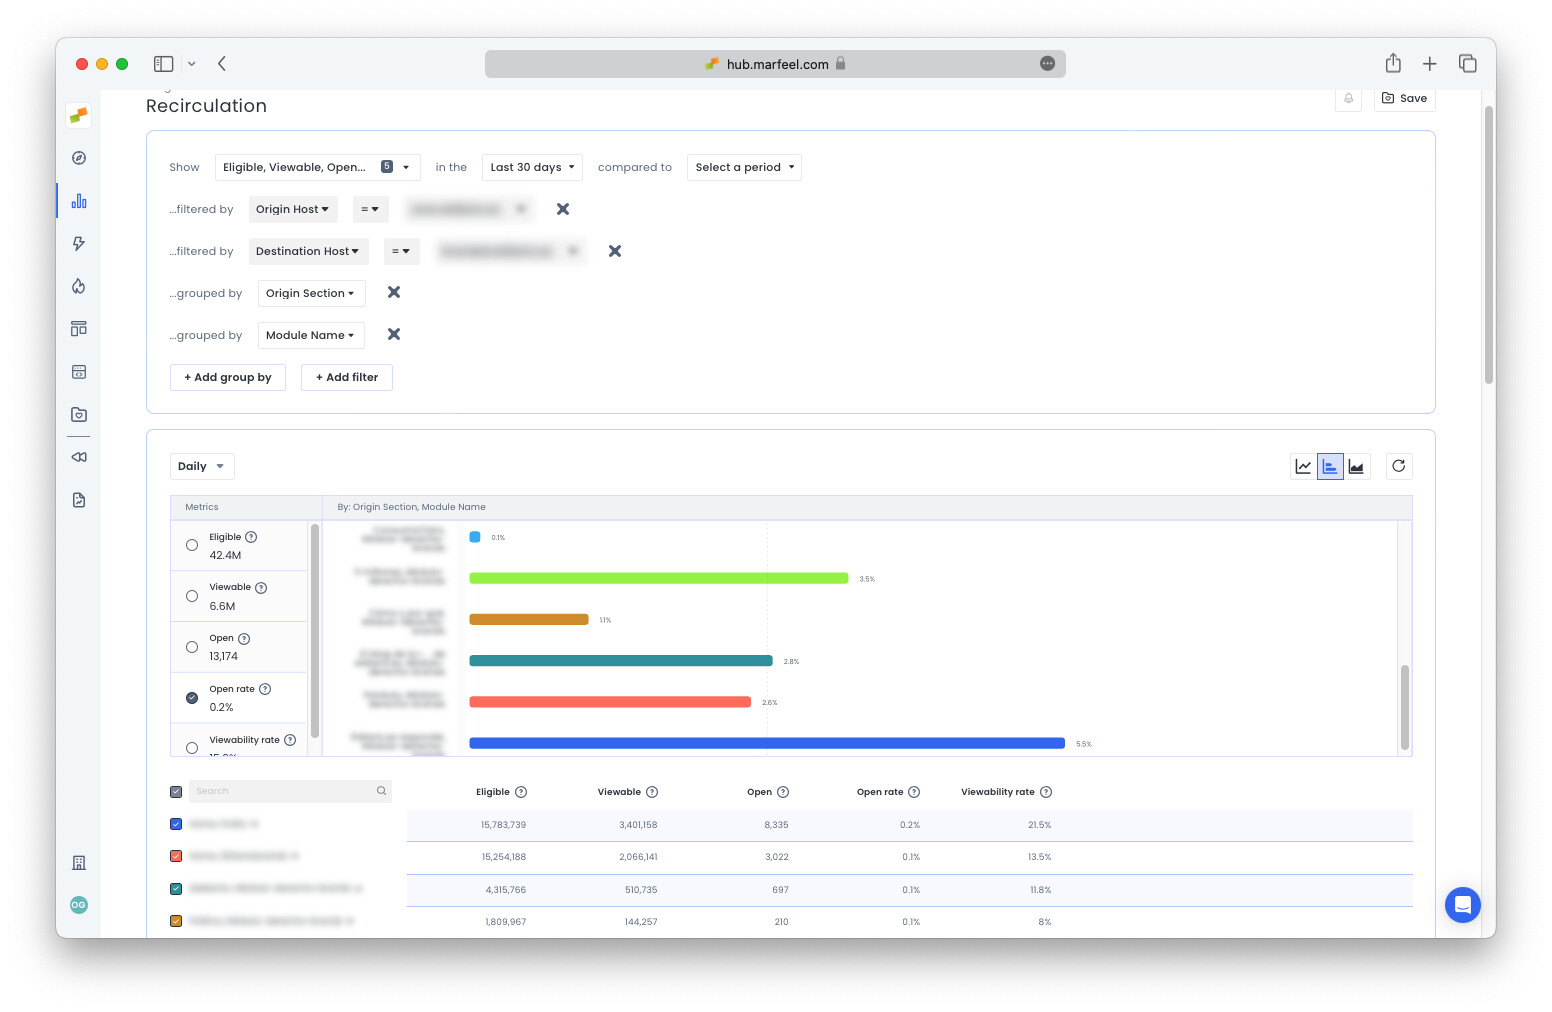
To increase traffic from the main domain to the branded one, the publisher could consider increasing the visibility and number of links in the modules with branded content in the sections where users are more disposed to reading branded content.
Are my Flowcards triggering too late?
One of the challenges with the Flowcard experiences is figuring out when to trigger them. Too high on the page, and they will become an annoying distraction for the reader. Too low on the page, and users will never see them.
To find out if a Flowcard is underperforming for the latter reason, check the Viewable metric. If viewability is quite low compared to other Flowcards, that could be an indication that the Flowcard needs to be triggered earlier. Adjust the Flowcards settings in Experiences > Format.