No longer will you wonder whether a sudden spike or drop in traffic is unique to your site or a result of a global shift affecting many publishers. With MarfeelCast, you can analyze and gain a clear understanding of the external factors influencing your traffic acquisition.
MarfeelCast provides insights into your traffic acquisition by displaying your share per traffic source and comparing it to Marfeel’s entire network over time. Additionally, it offers a volatility index, allowing you to identify how predictable and controlled is the traffic.
MarfeelCast help you answering these questions:
- Has the traffic fallen for other publishers too, or am I alone in this? Has there been a platform-related issue (Google, Facebook, etc.) or a core update?
- Is my site’s traffic overexposed or underexposed to Google Discover or to any other traffic sources?
- How volatile is the channel? Is my traffic more volatile than for others?
MarfeelCast Metrics
MarfeelCast provides several metrics to allow analysts understand traffic distribution.
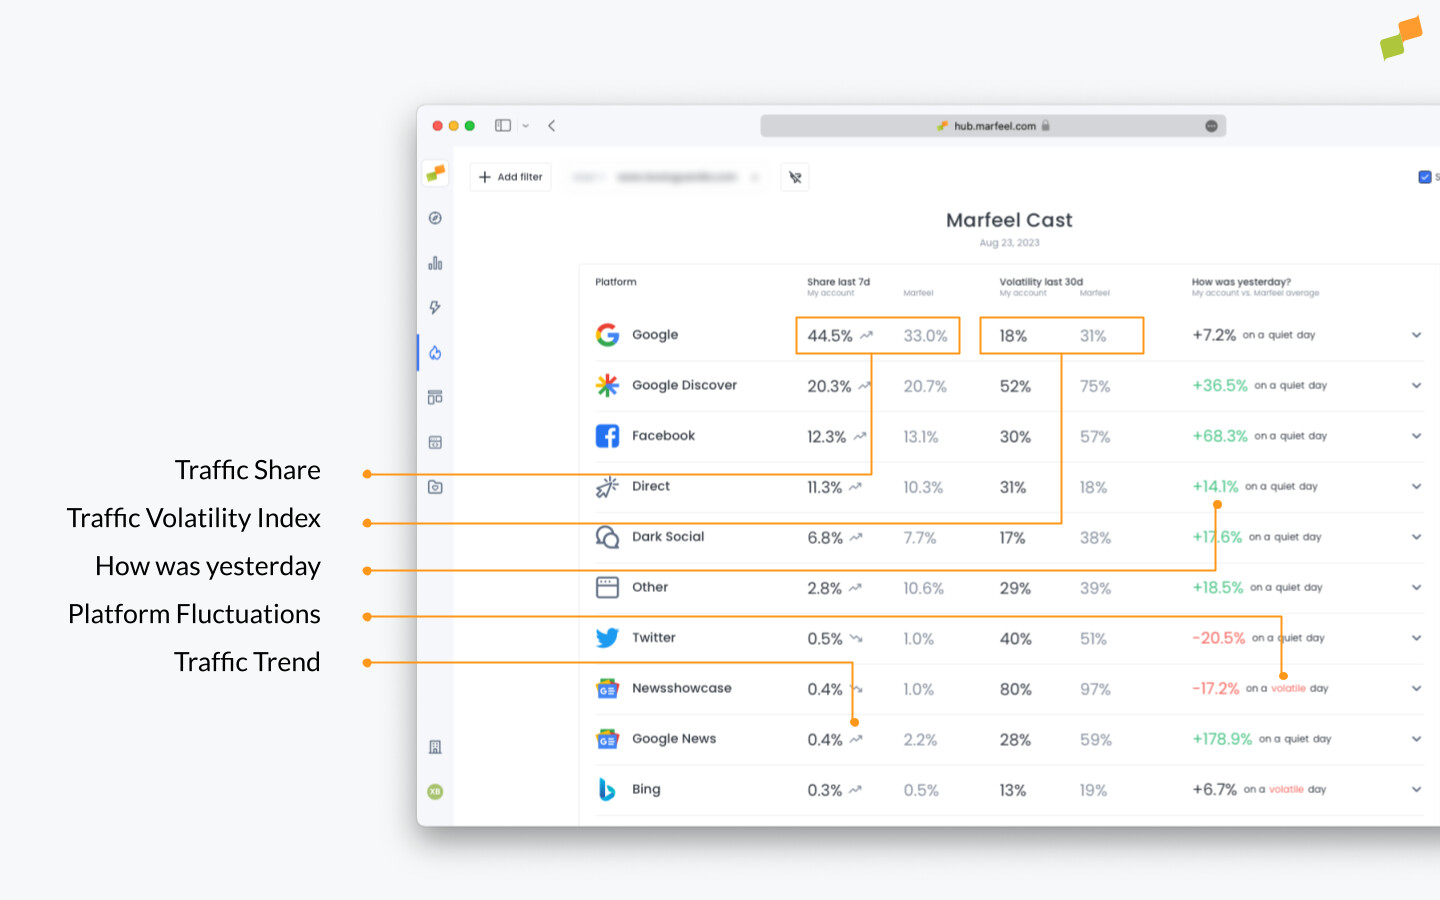
Traffic Share last 7 days
The Traffic Share of a channel describes the percentage of traffic a publisher receives from a certain source compared to the total. The metric in the table is calculated for the last 7 days. The graphic provides a daily timeseries.
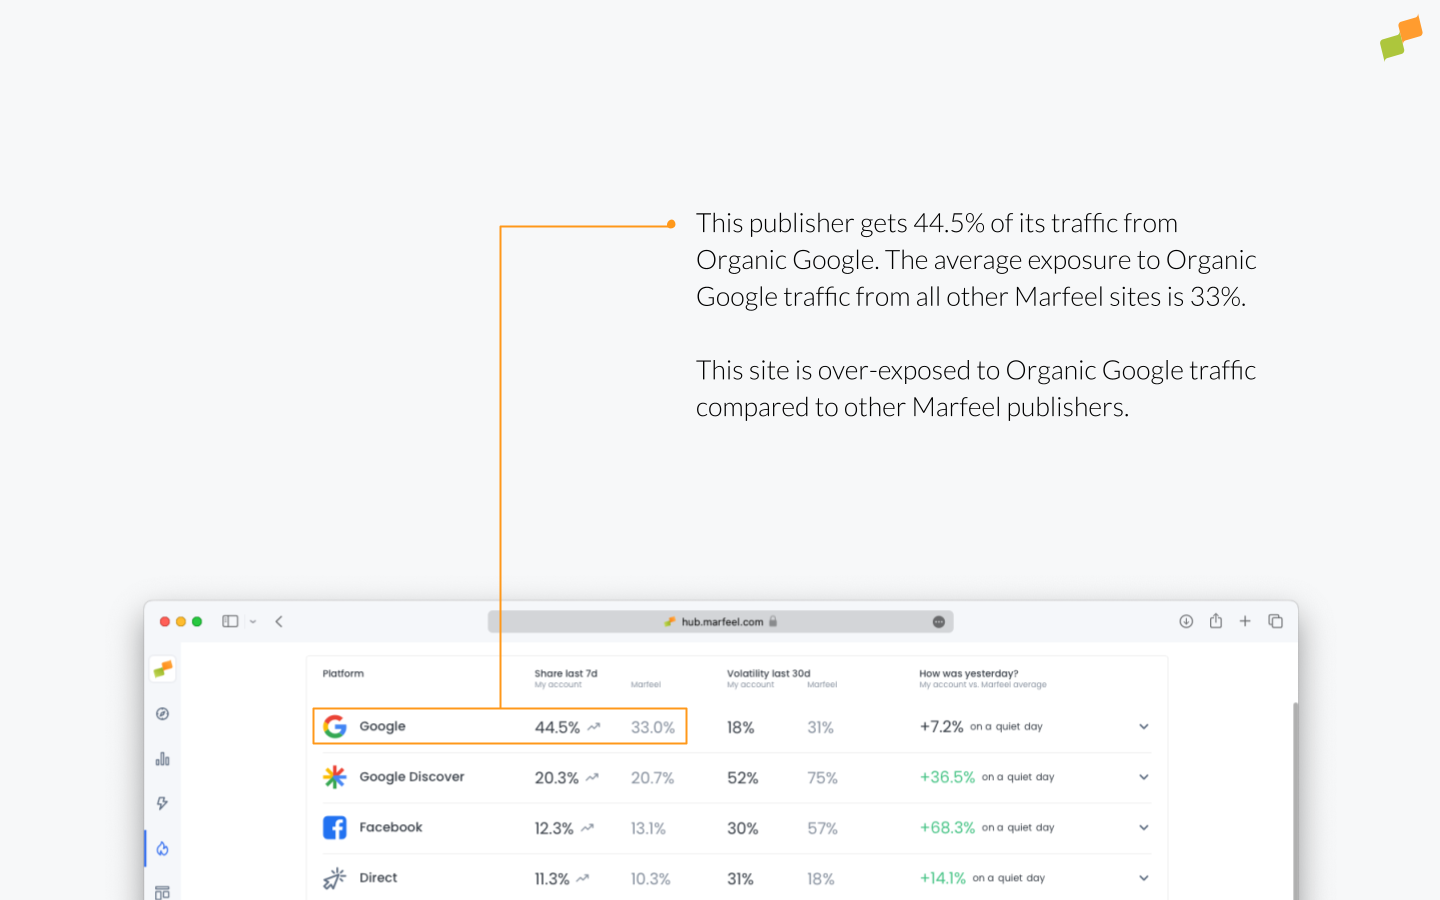
Benchmarking the Traffic Share of a channel to Marfeel allows publishers to understand if their traffic is over-exposed or under-exposed to it.
- Being over-exposed normally means the publisher is doing a good job on the channel. If so it normally means there are serious opportunities to grow other channels
- If under-exposed it indicates an important opportunity to expand the penetration on the channel.
It is possible that an article’s peak performance in one channel might lead to a temporary decrease in performance across other channels.
Traffic Volatility Index last 30d
Volatility informs how reliable a certain channel is on sending a steady traffic flow. A high number means that traffic coming from this channel is bumpy and unreliable, while a low number means that it has shown a consistent performance during last month.
It is calculated both for own’s traffic and Marfeel average, as the division between average week over week standard deviation, in absolute numbers, between average traffic.
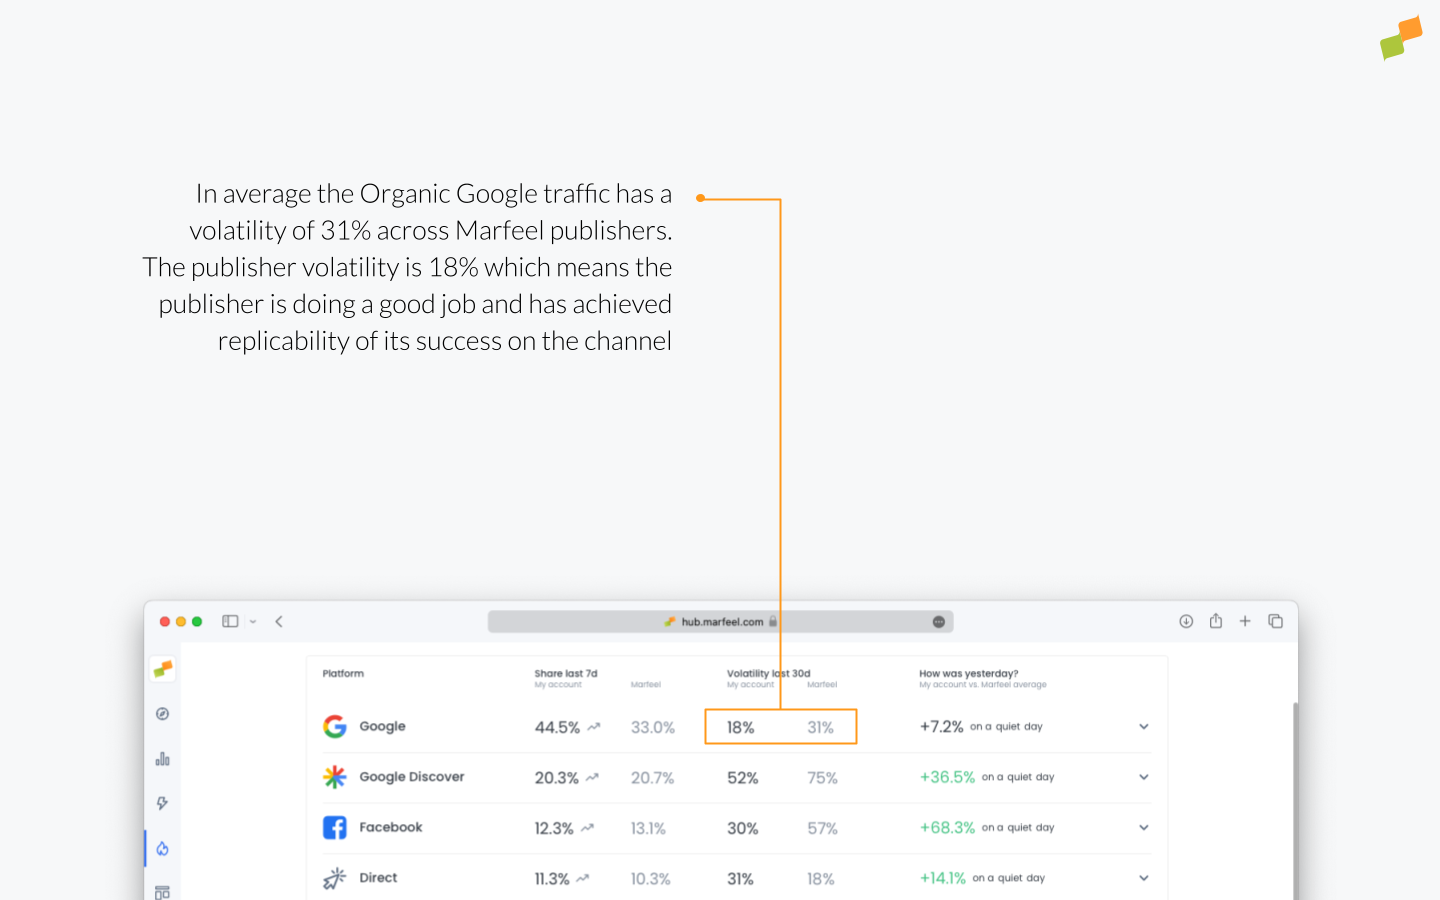
Benchmarking the Volatility of a channel to Marfeel allows publishers to understand if they master the channel and have achieved predictability compared to others.
How was yesterday?
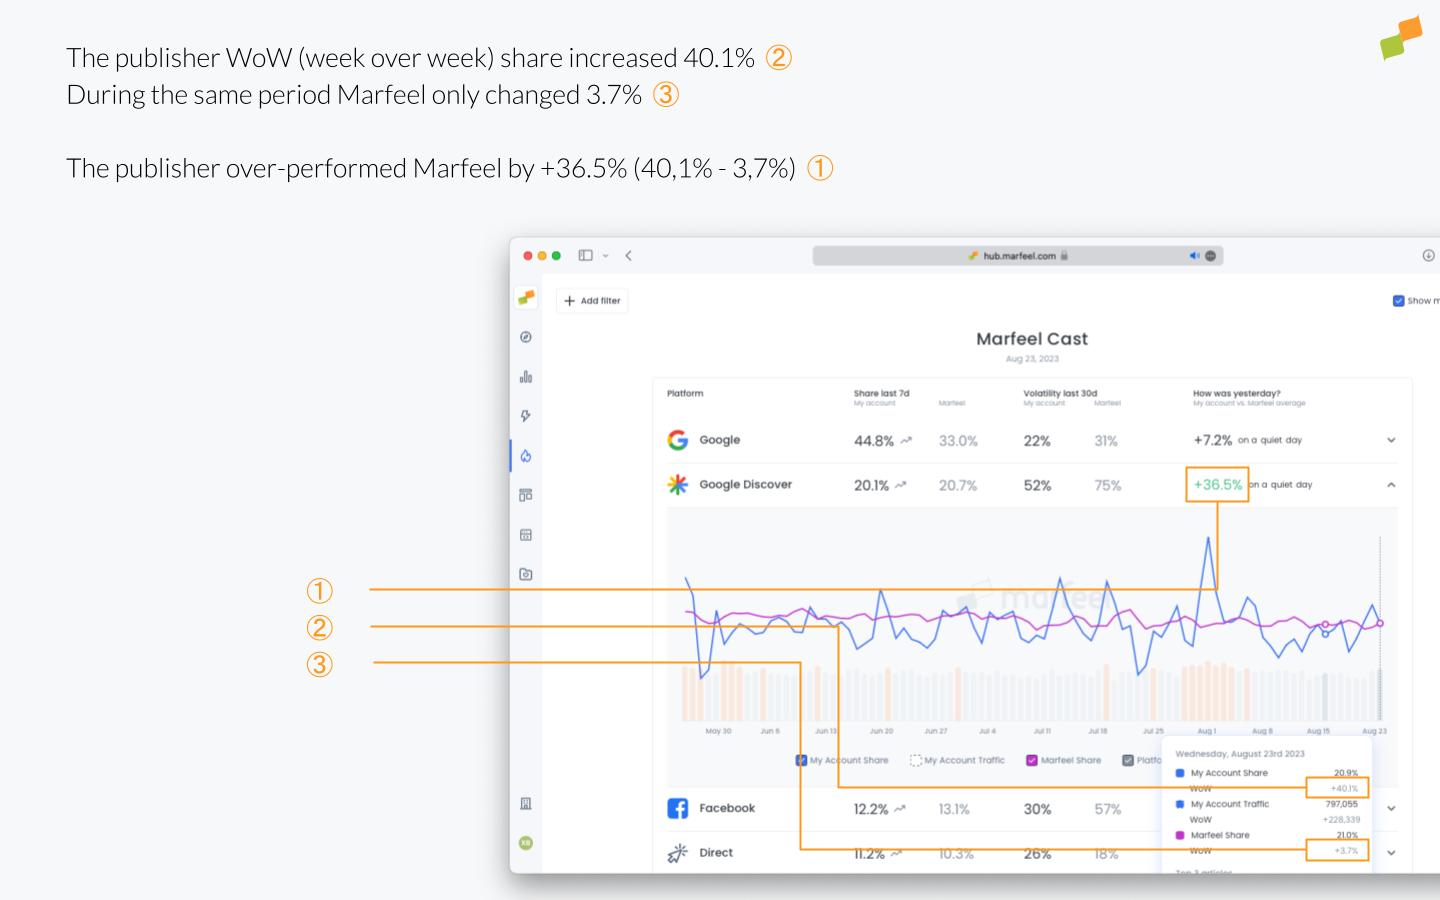
The percentage shown on this column represents yesterday’s performance of your account, compared to same day of previous week.
This is then normalized by subtracting from it the same performance but calculated as an average across Marfeel instead.
Platform Volatility & Update Detector
Marfeel informs whether yesterday was a quiet or volatile day for other publishers. It looks at all of Marfeel’s accounts and checks whether the percentage of sites with a relevant standard deviation for the channel was high or low.
If lots of sites had a volatile day it might mean that there were external factors like platform or core updates affecting the channel traffic.
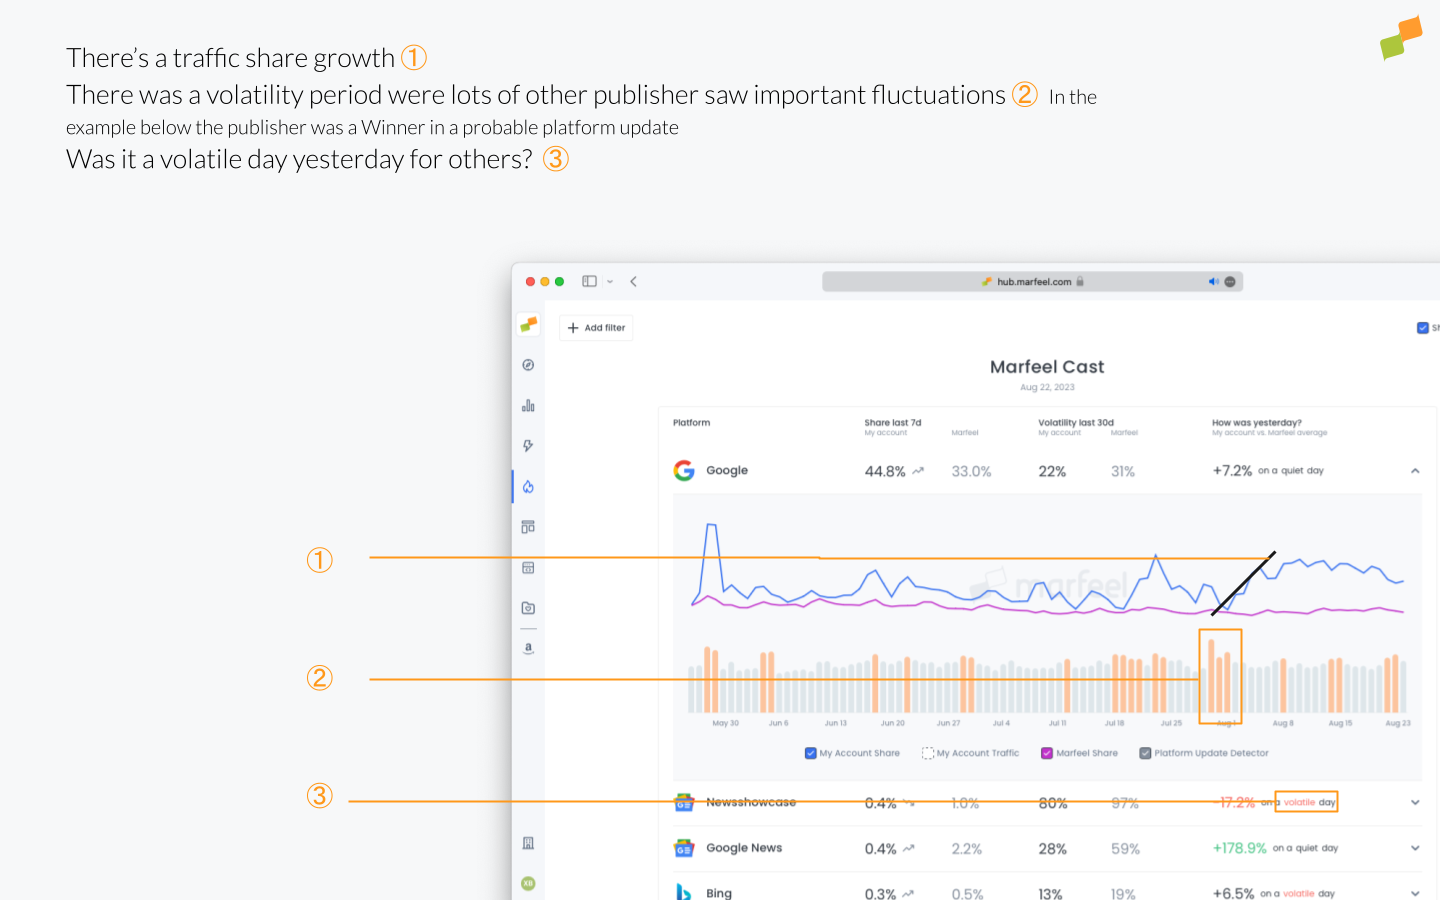
The bars represent how volatile was each day, normalized to the usual volatility of the channel, by checking which percentage of sites experimented relevant traffic changes for the expanded channel on each day. Above a certain number, bars are represented with a different color to make it easier to spot the highest volatility dates, which could hint of an algorithm update on this source channel.
Trend
Trend is calculated as the last 2 weeks regression slope for each channel’s traffic line. Whenever this results in lower than -1% or higher than 1%, a trend arrow will be displayed alongside last 7 days share’s number.
It is intended to inform whether last week’s share number is significantly higher or lower than previous benchmark, and it is highlighted both for own’s traffic and Marfeel’s average.
Chart metrics
Each table row is expandable, displaying last 90 days data on a chart. 4 different metrics are painted on it, and hovering over then displays a tooltip with even more detailed information.
My Account Share
This line represents the share of your accounts traffic that came from the expanded channel, for each day. This average is logarithmically weighted by domain.
My Account Traffic
This line represents the actual traffic that came from the expanded source channel, in absolute numbers.
This is useful to understand whether a change in traffic share was caused by surges or drops in other channels instead of this one.
Marfeel Share
This line represents the average share of all of Marfeel accounts traffic that came from the expanded channel, for each day. This average is logarithmically weighted by domain.
Tooltip
When hovering over the chart, a tooltip is shown displaying a table. This table includes the numbers of the 3 representable lines (My Account Share, My Account Traffic and Marfeel Share) and also the week-over-week percentage increase or decrease of each of them. The previous week point used for the calculation is also highlighted on the chart as a visual help.
The tooltip also shows the top 3 articles on the channel to help understand what moved the needle on that day.
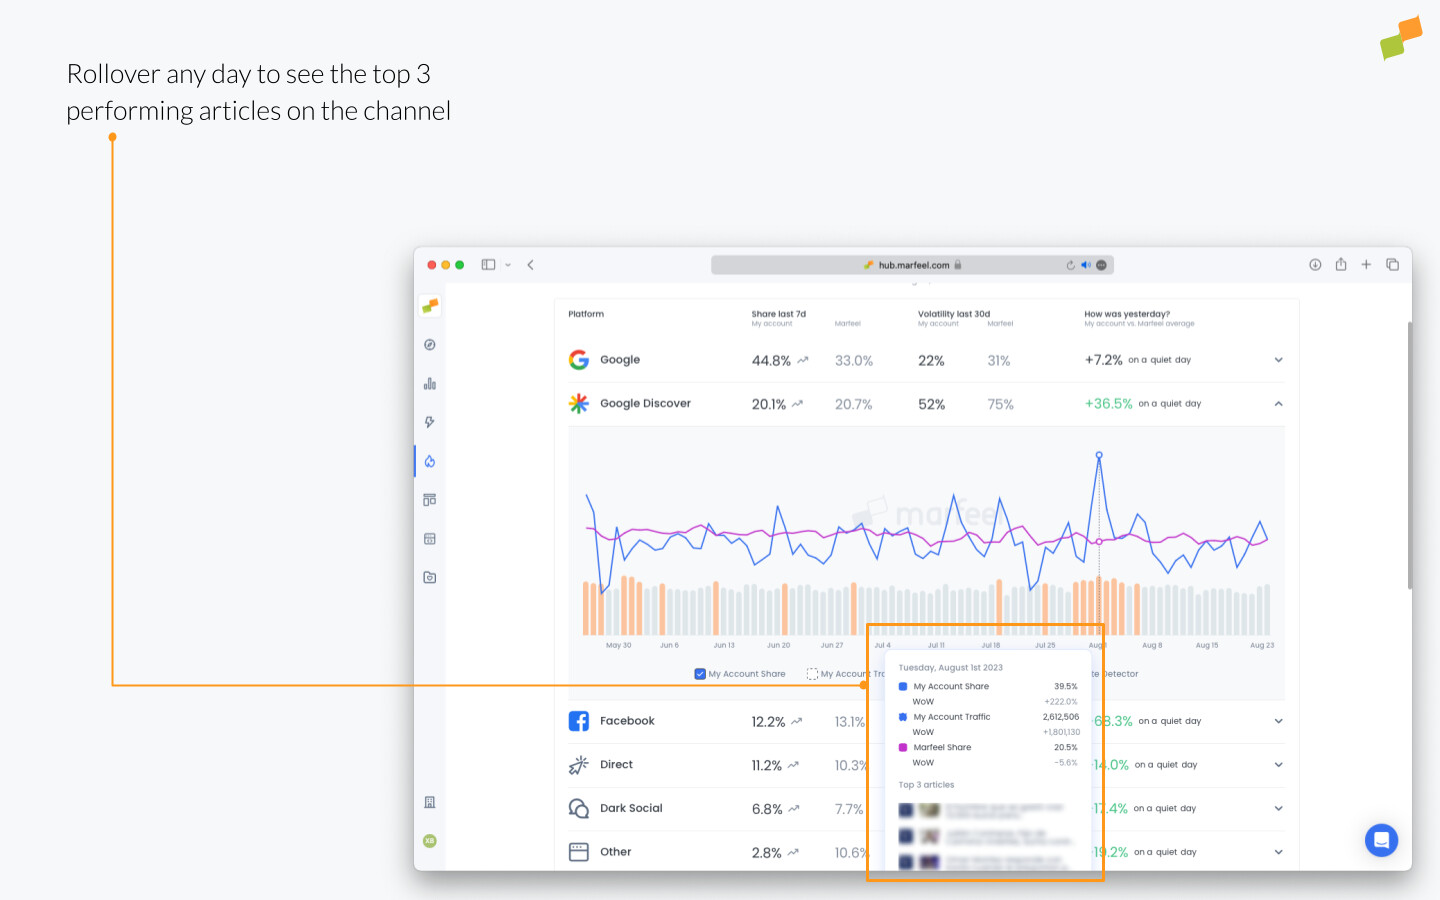
Finally, a link with “Read more” is also included to navigate to realtime screen, filtered by selected source channel and date.
Filters
On the top left of the screen, you can filter your site’s data by host and by folder.
On the right side of the screen, you can deactivate showing your site’s data, in case you want to share Marfeel’s average numbers in a screenshot without displaying sensitive data.
Access
Access to MarfeelCast module is restricted to Analyst roles.