The Marfeel extension for Google Sheets allows you to view the data in spreadsheet form for analysis and to create custom data visualizations. You can schedule regular data updates from within the sheet.
As part of Marfeel’s data exports offerings, the Google sheets extension makes it possible to export data via the JSON API right from Explore in order to:
- Build charts and perform custom analysis with Marfeel explore data in spreadsheet form
- Schedule reports right from the Sheets extension
Set up the Marfeel for Google Sheets Add-on
- In Google Sheets, go to Extensions > Add-ons > Get Add Ons
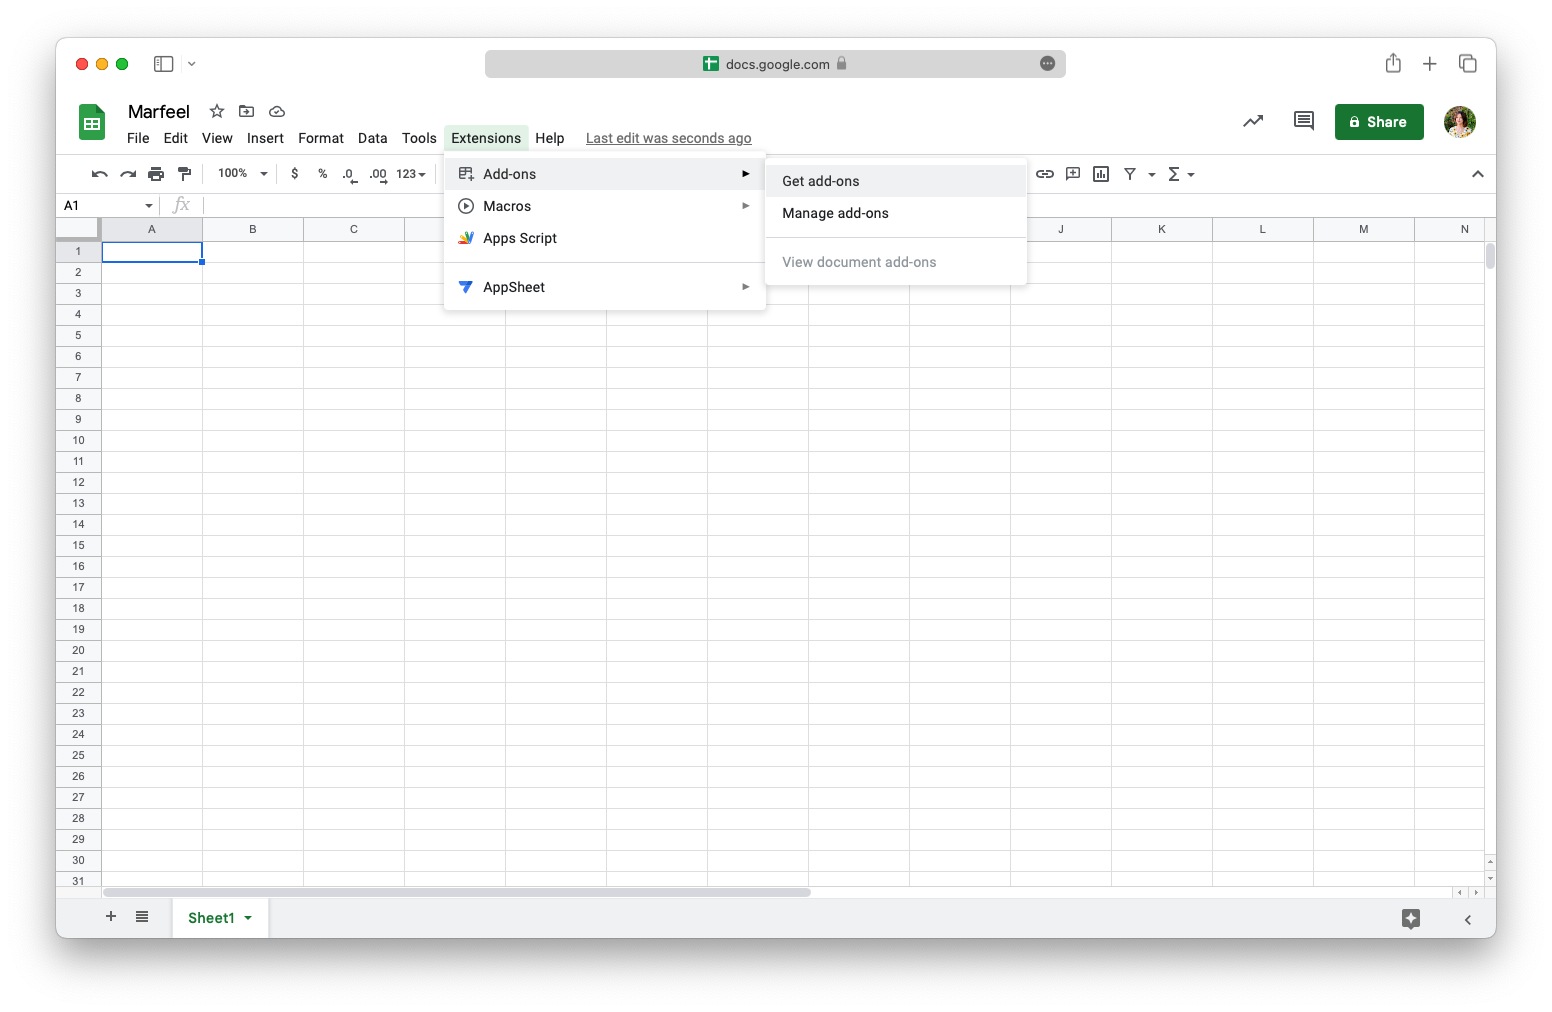
- Search for “Marfeel” or “Marfeel for Google Sheets”
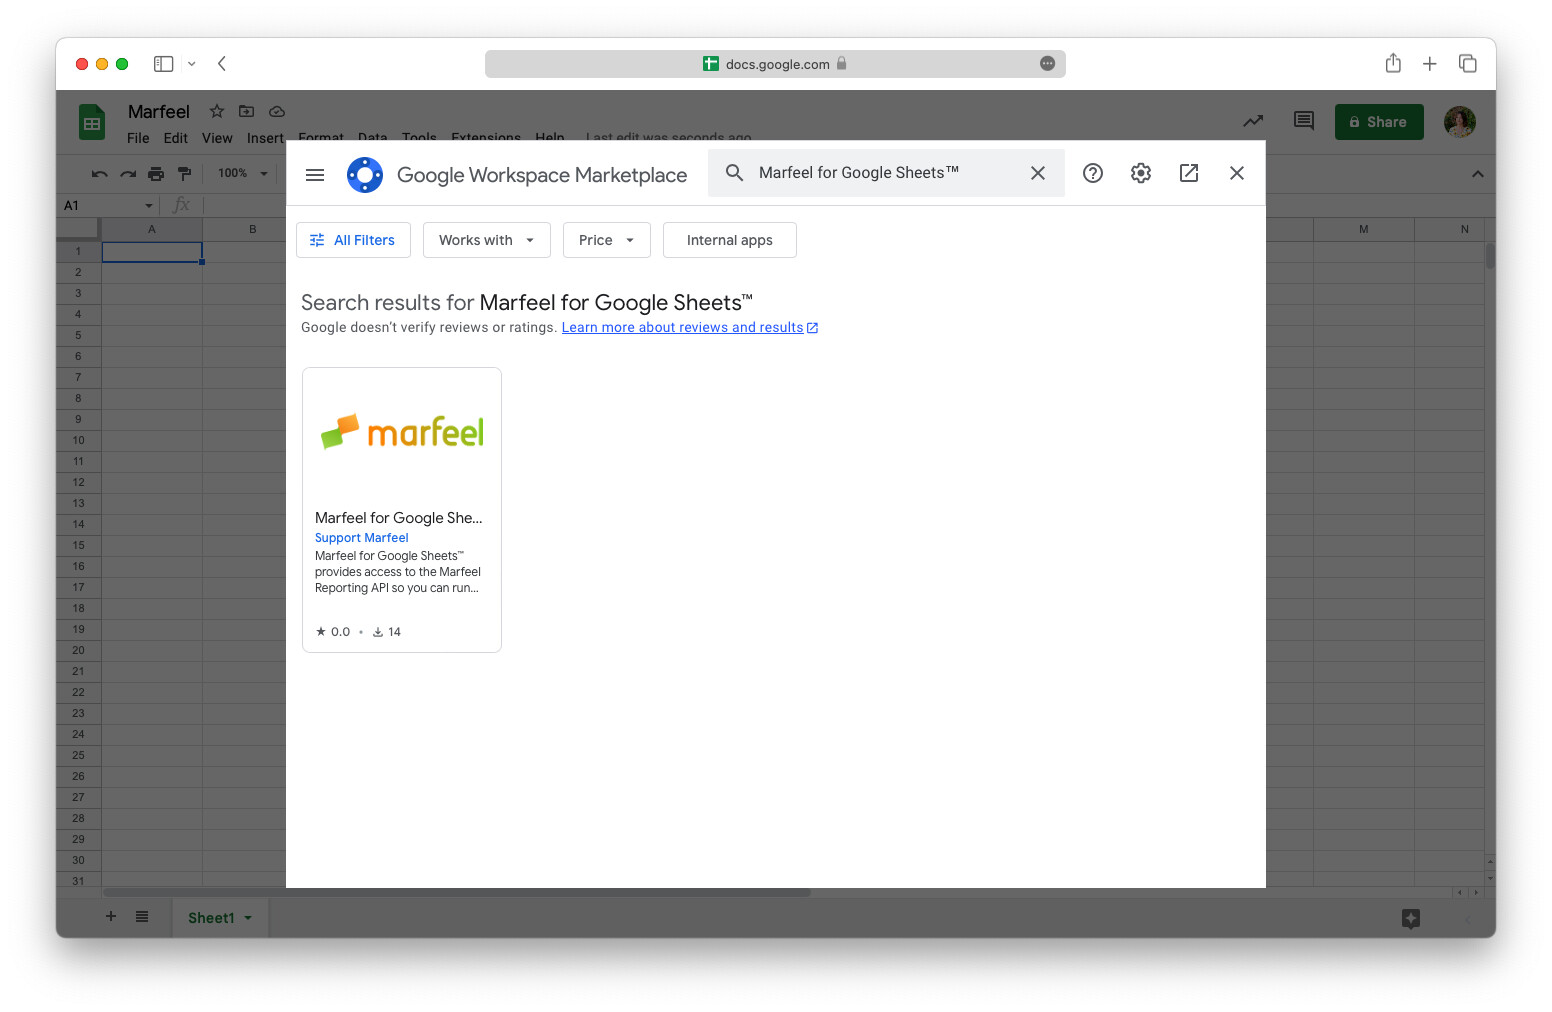
- Select the Marfeel extension and click
Install - Click
Continue - Log into your Google account
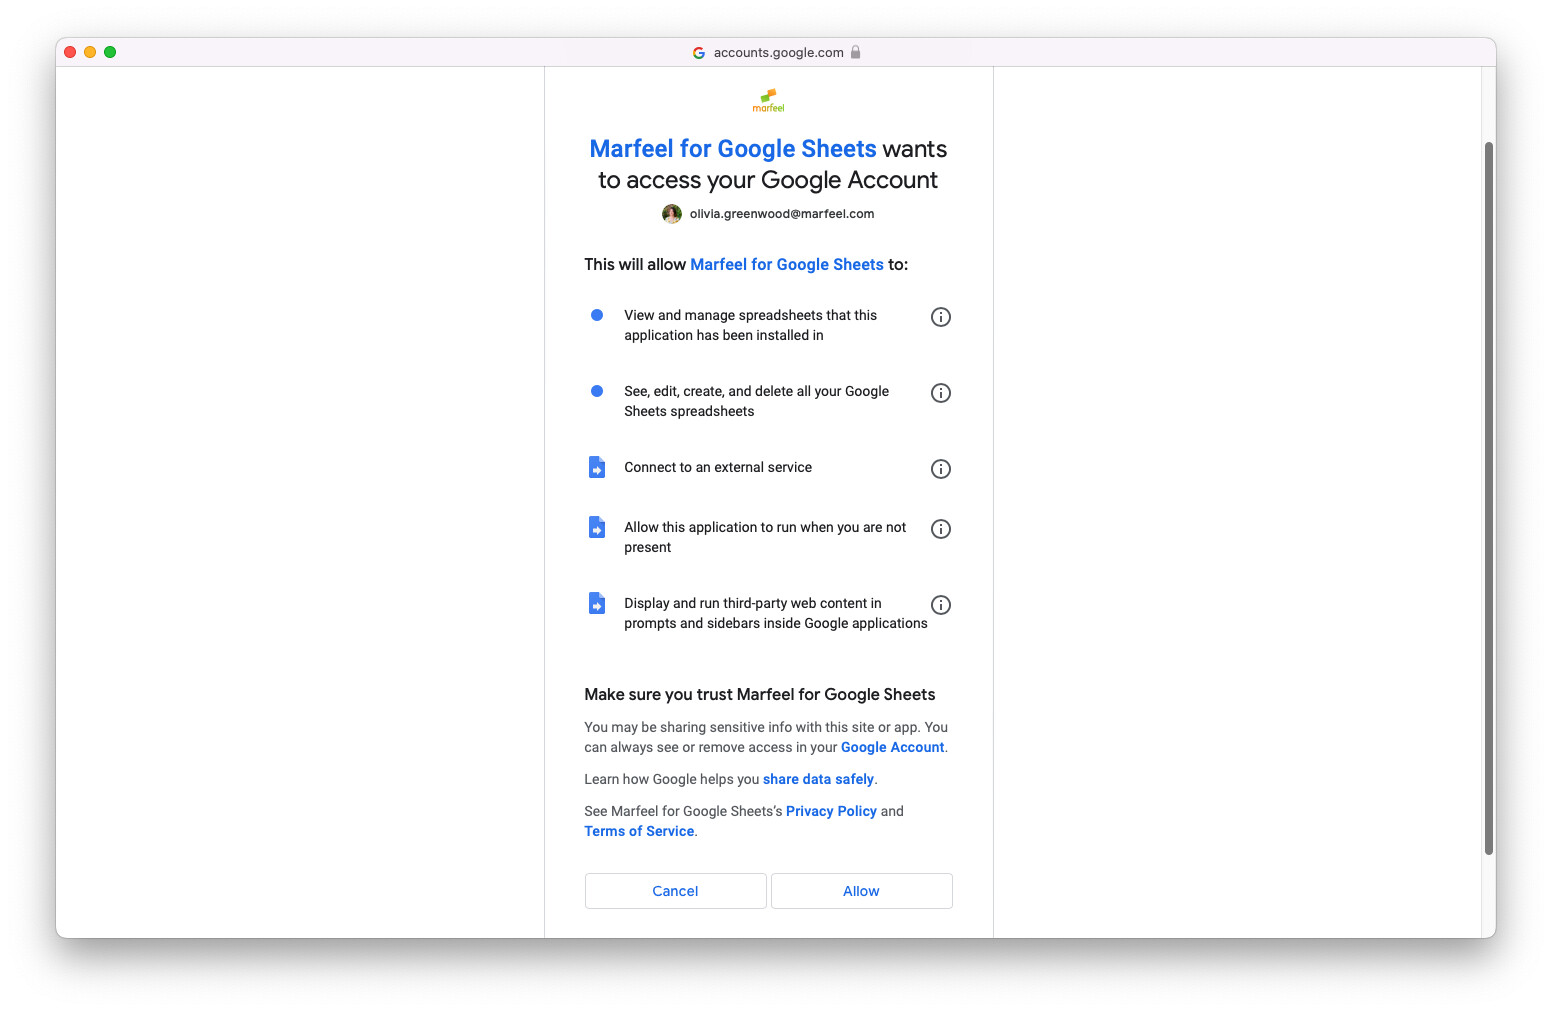
- The following screen will display all the permissions you’ll need to enable to run the application. Click
Allow.
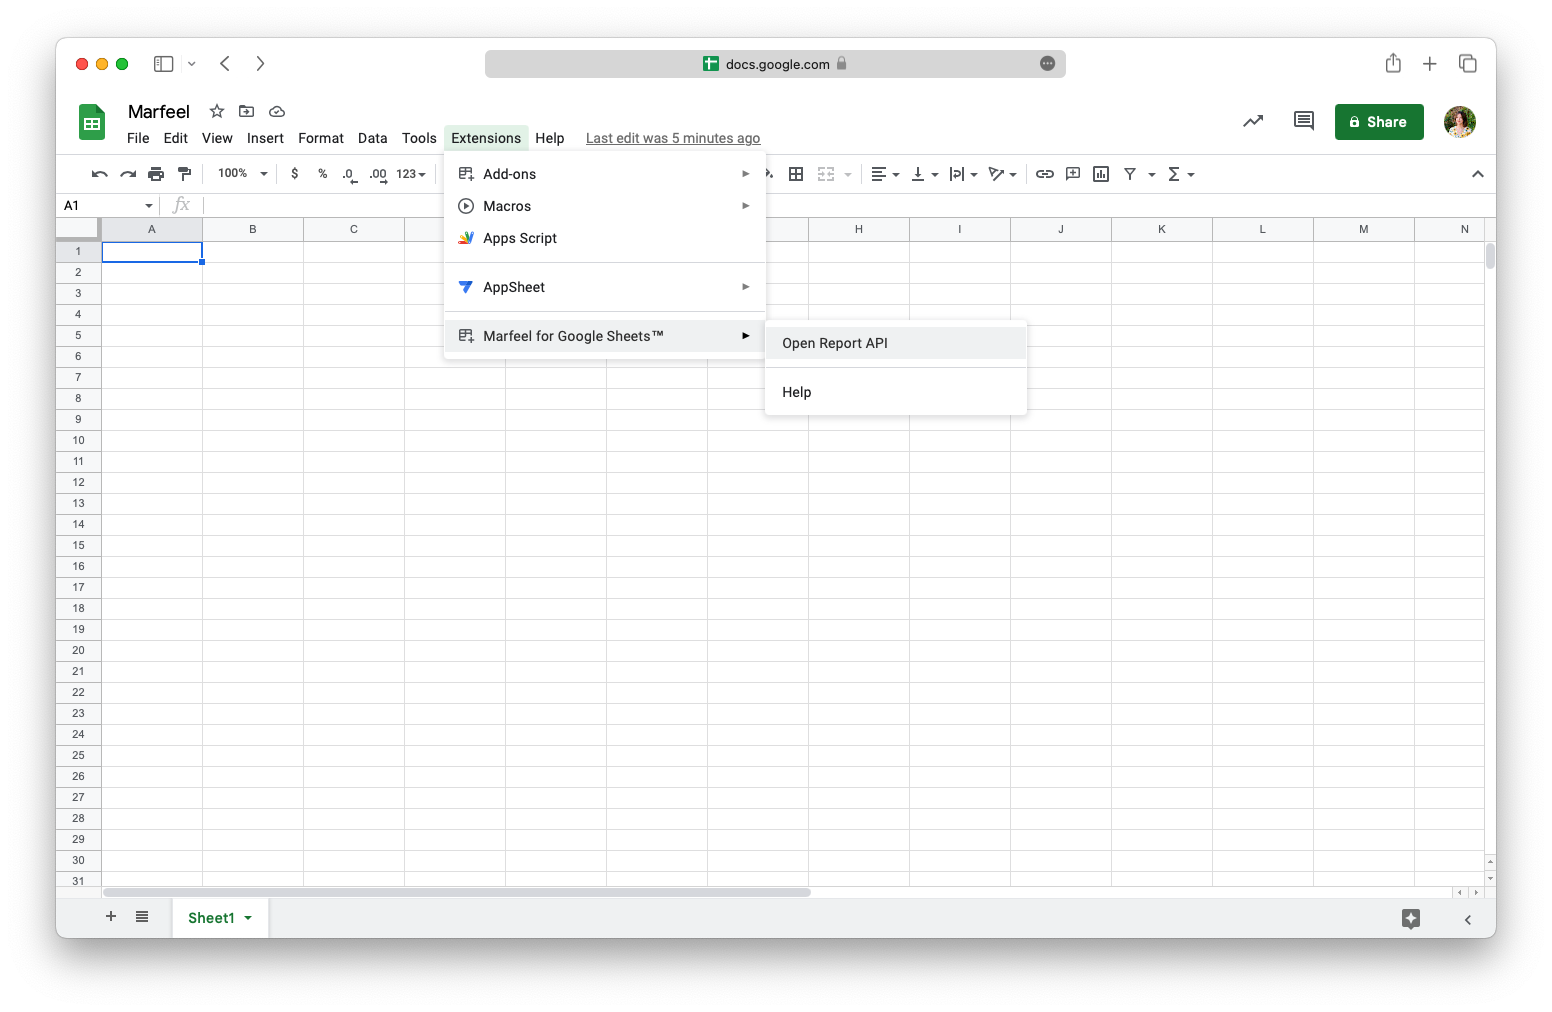
- Marfeel for Sheets will now appear under the Extensions menu. To enable it, go to Extensions >
Open Report API
- Enter your Marfeel-associated email and password in the sidebar
- Once your user is verified, click
Create sheetin the sidebar to create the following sheet:
You’re all set up! Learn more about how to use the Marfeel Google Sheets Extension below.
How to use Marfeel for Google Sheets
Once the add-on is enabled, open a new Sheet and go to Extensions > Marfeel for Google Sheets > Open Report API any time to create a new sheet or access saved sheets in your Google Drive.
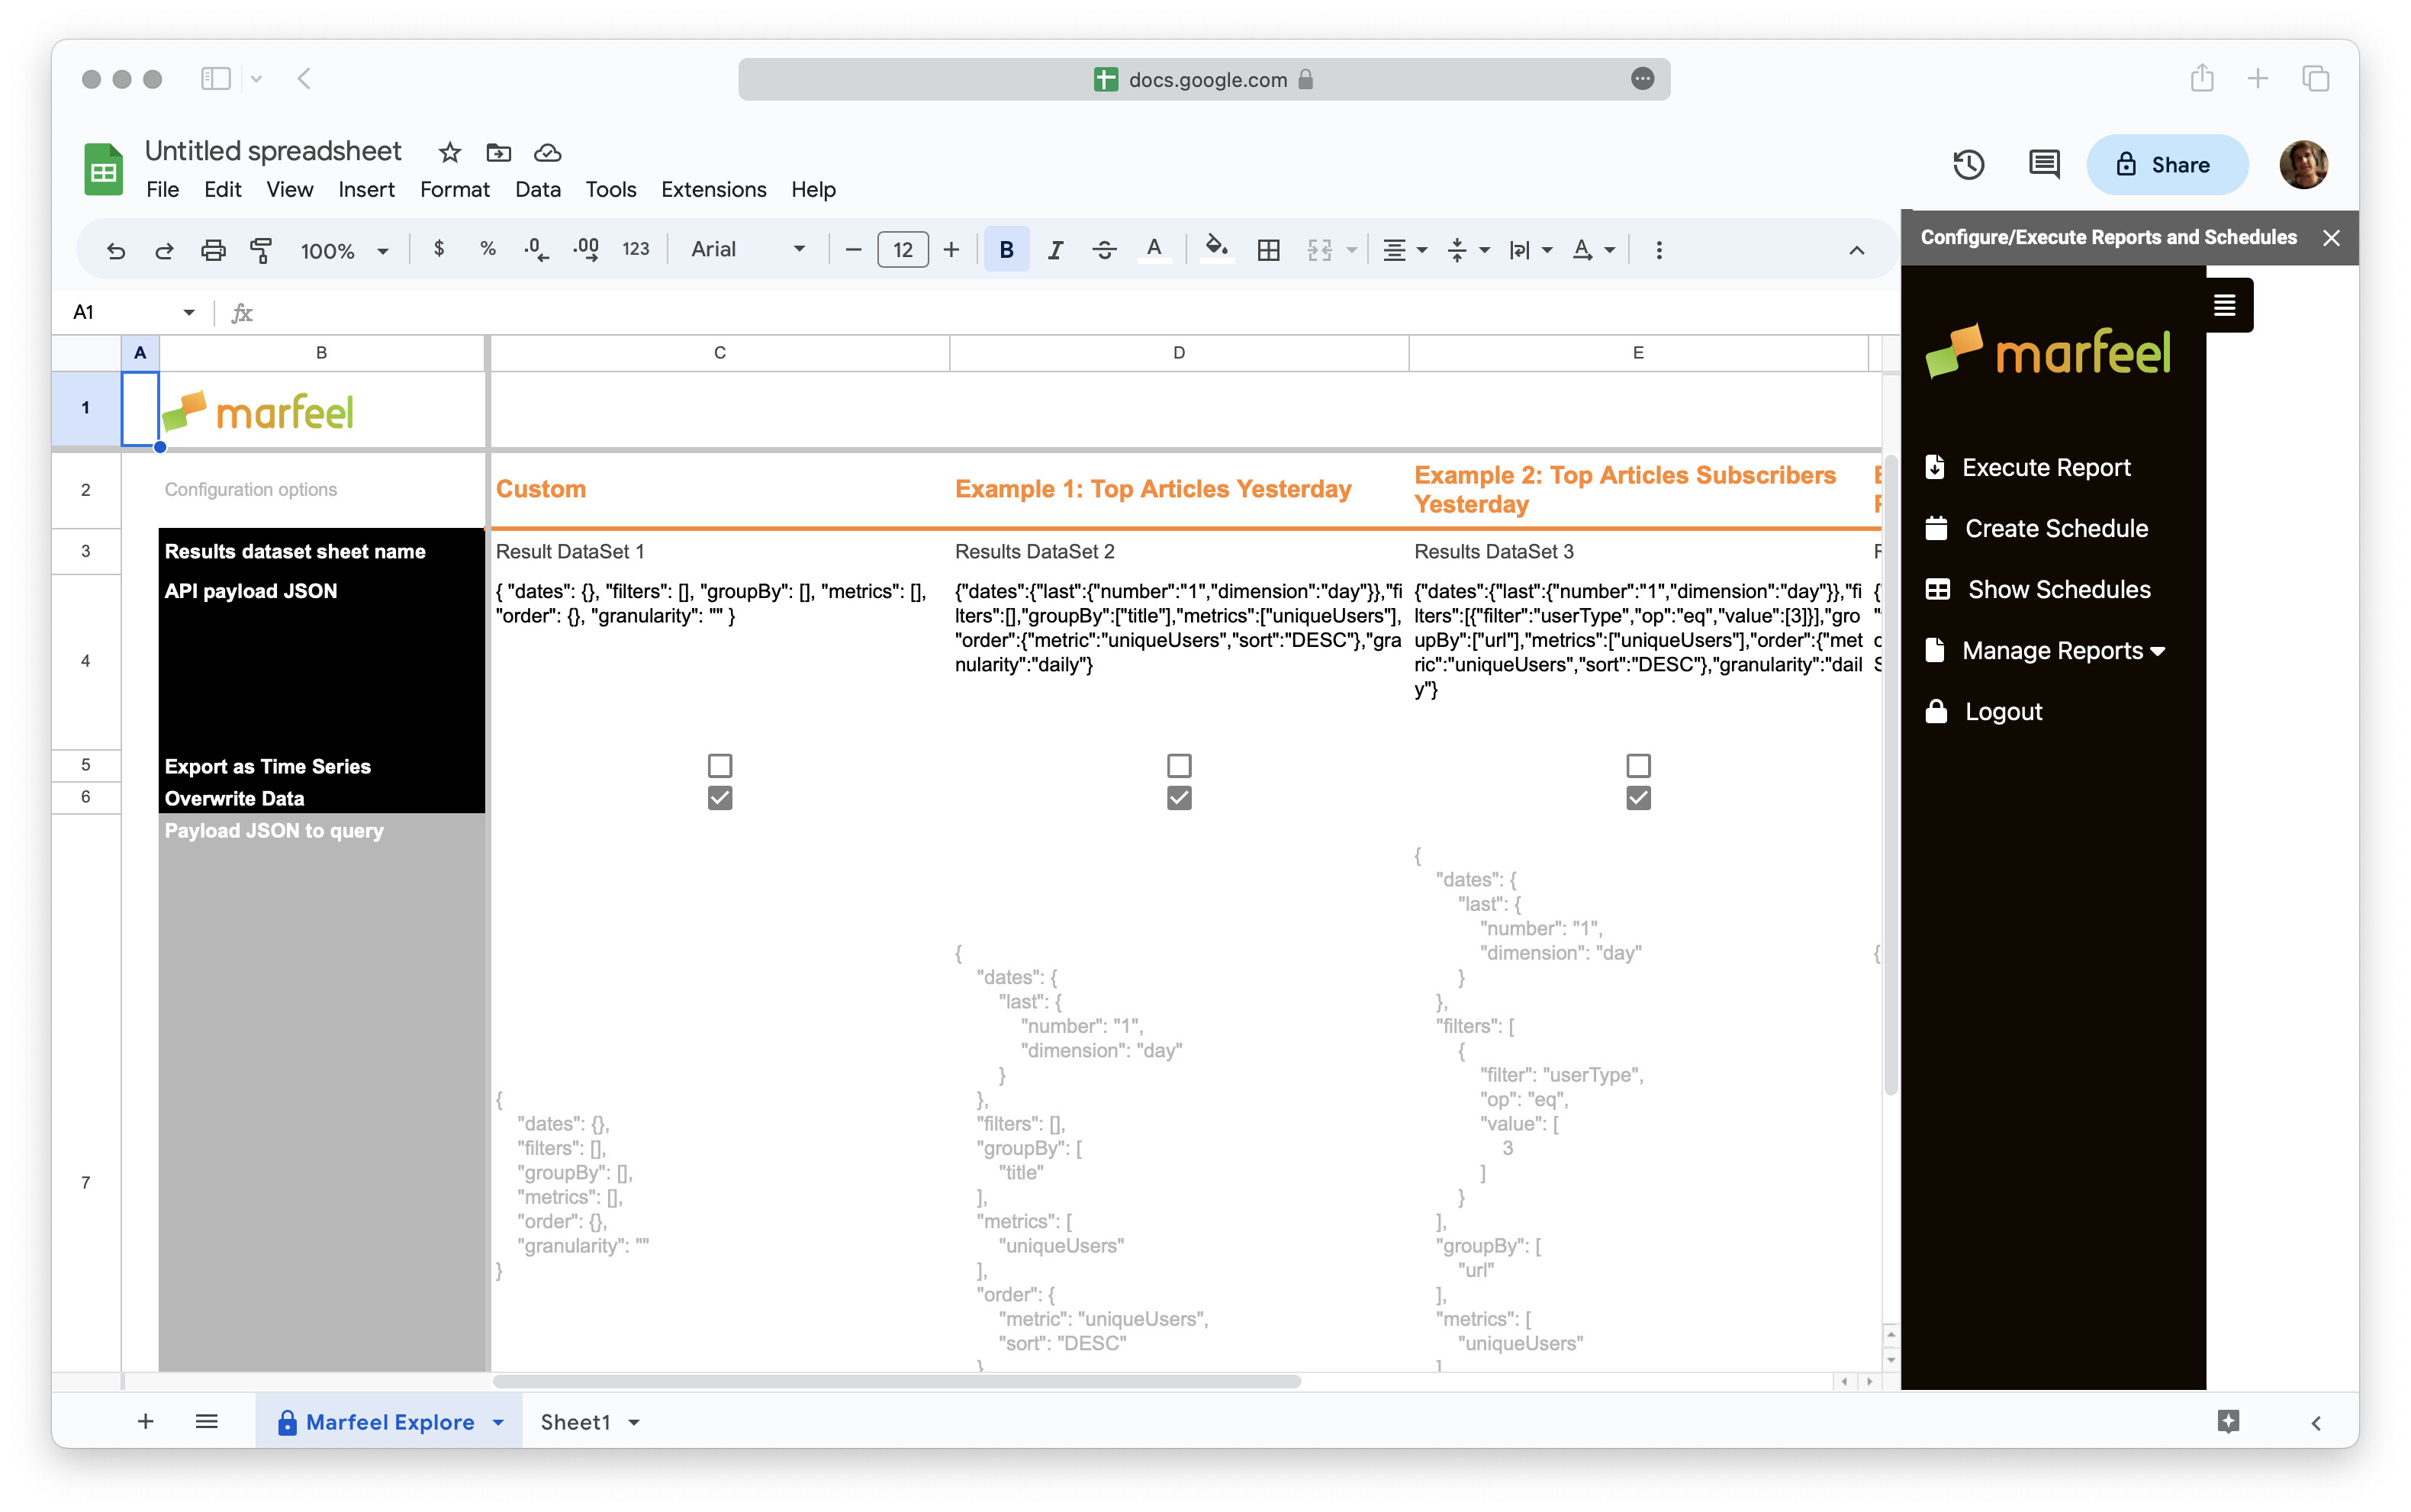
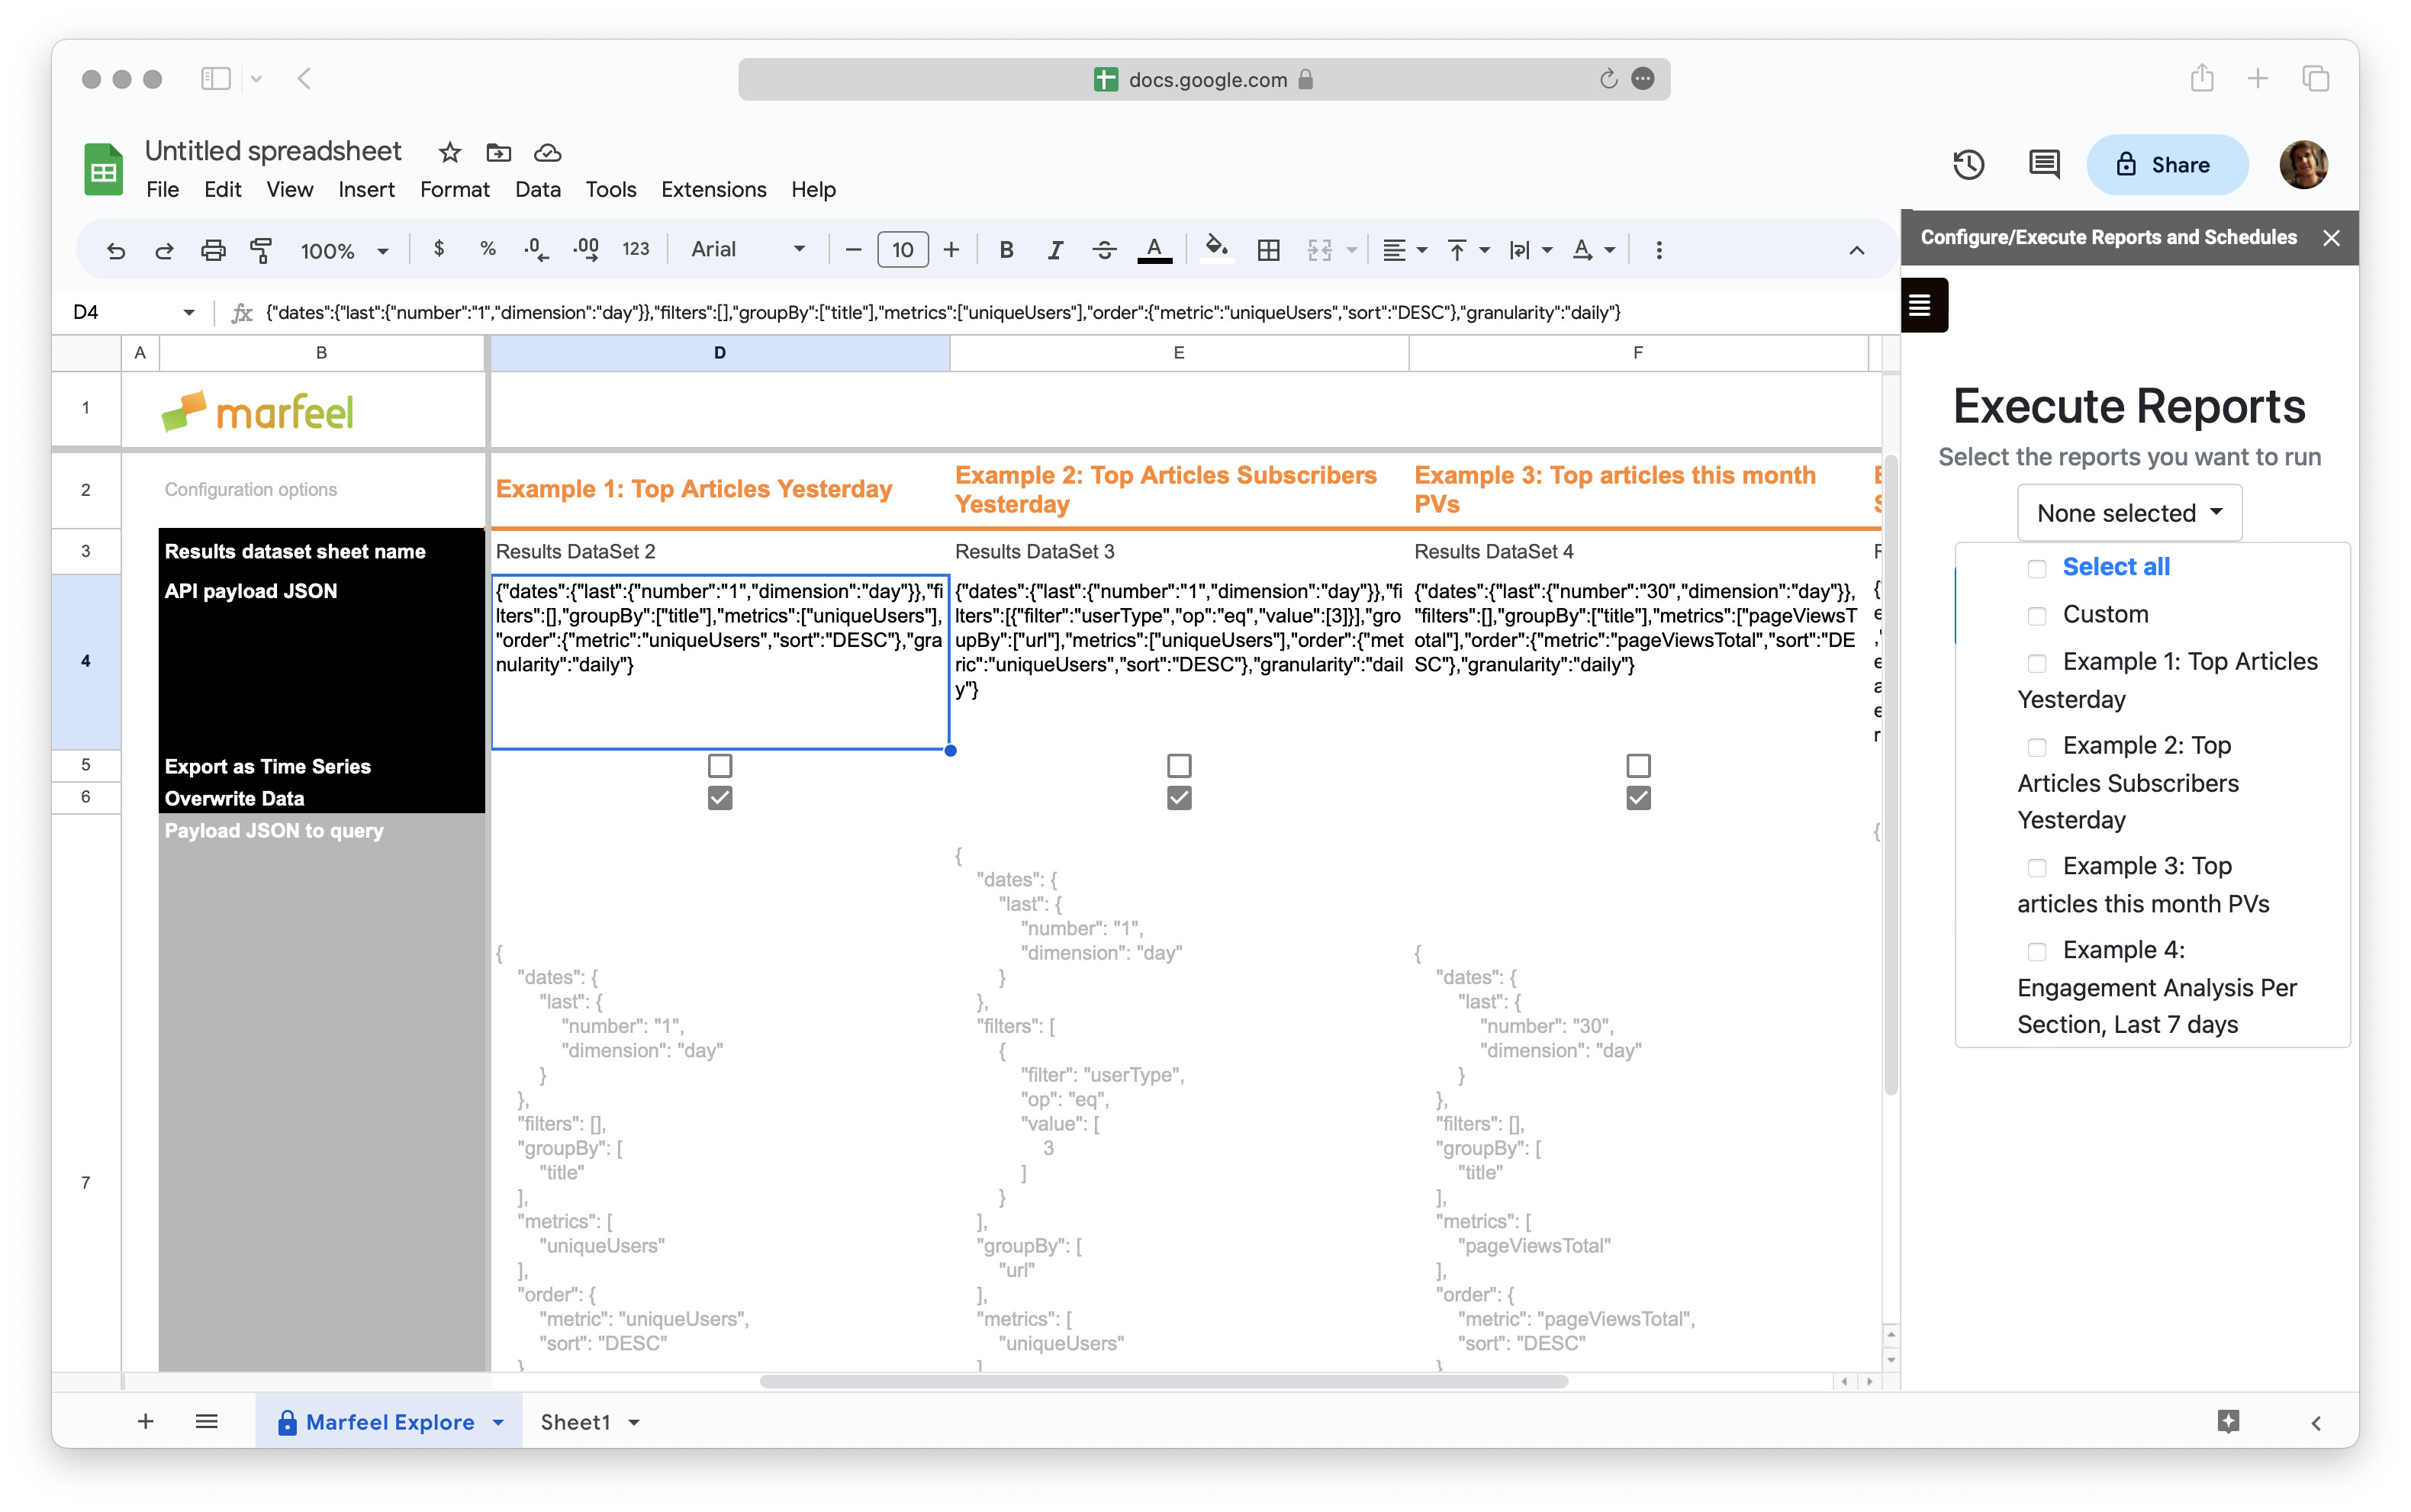
The Marfeel Explore sheet has 5 columns. Each column represents a different report (scroll to the right to see the rest of the columns:
First report starts empty, and the other 4 are prefilled with examples. They are all editable to adapt to any individual needs.
- Custom: empty example, mostly for one-time execution queries.
- Example 1: Top articles yesterday: the top performing articles from the previous day
- Example 2: Top articles subscribers yesterday: the articles that were the last editorial hit for the most subscribers
- Example 3: Top articles this month PVs: the articles with the most pageviews during the current month
- Example 4: Engagement Analysis Per Section, Last 7 days: Average engagement time and ads per page, per section
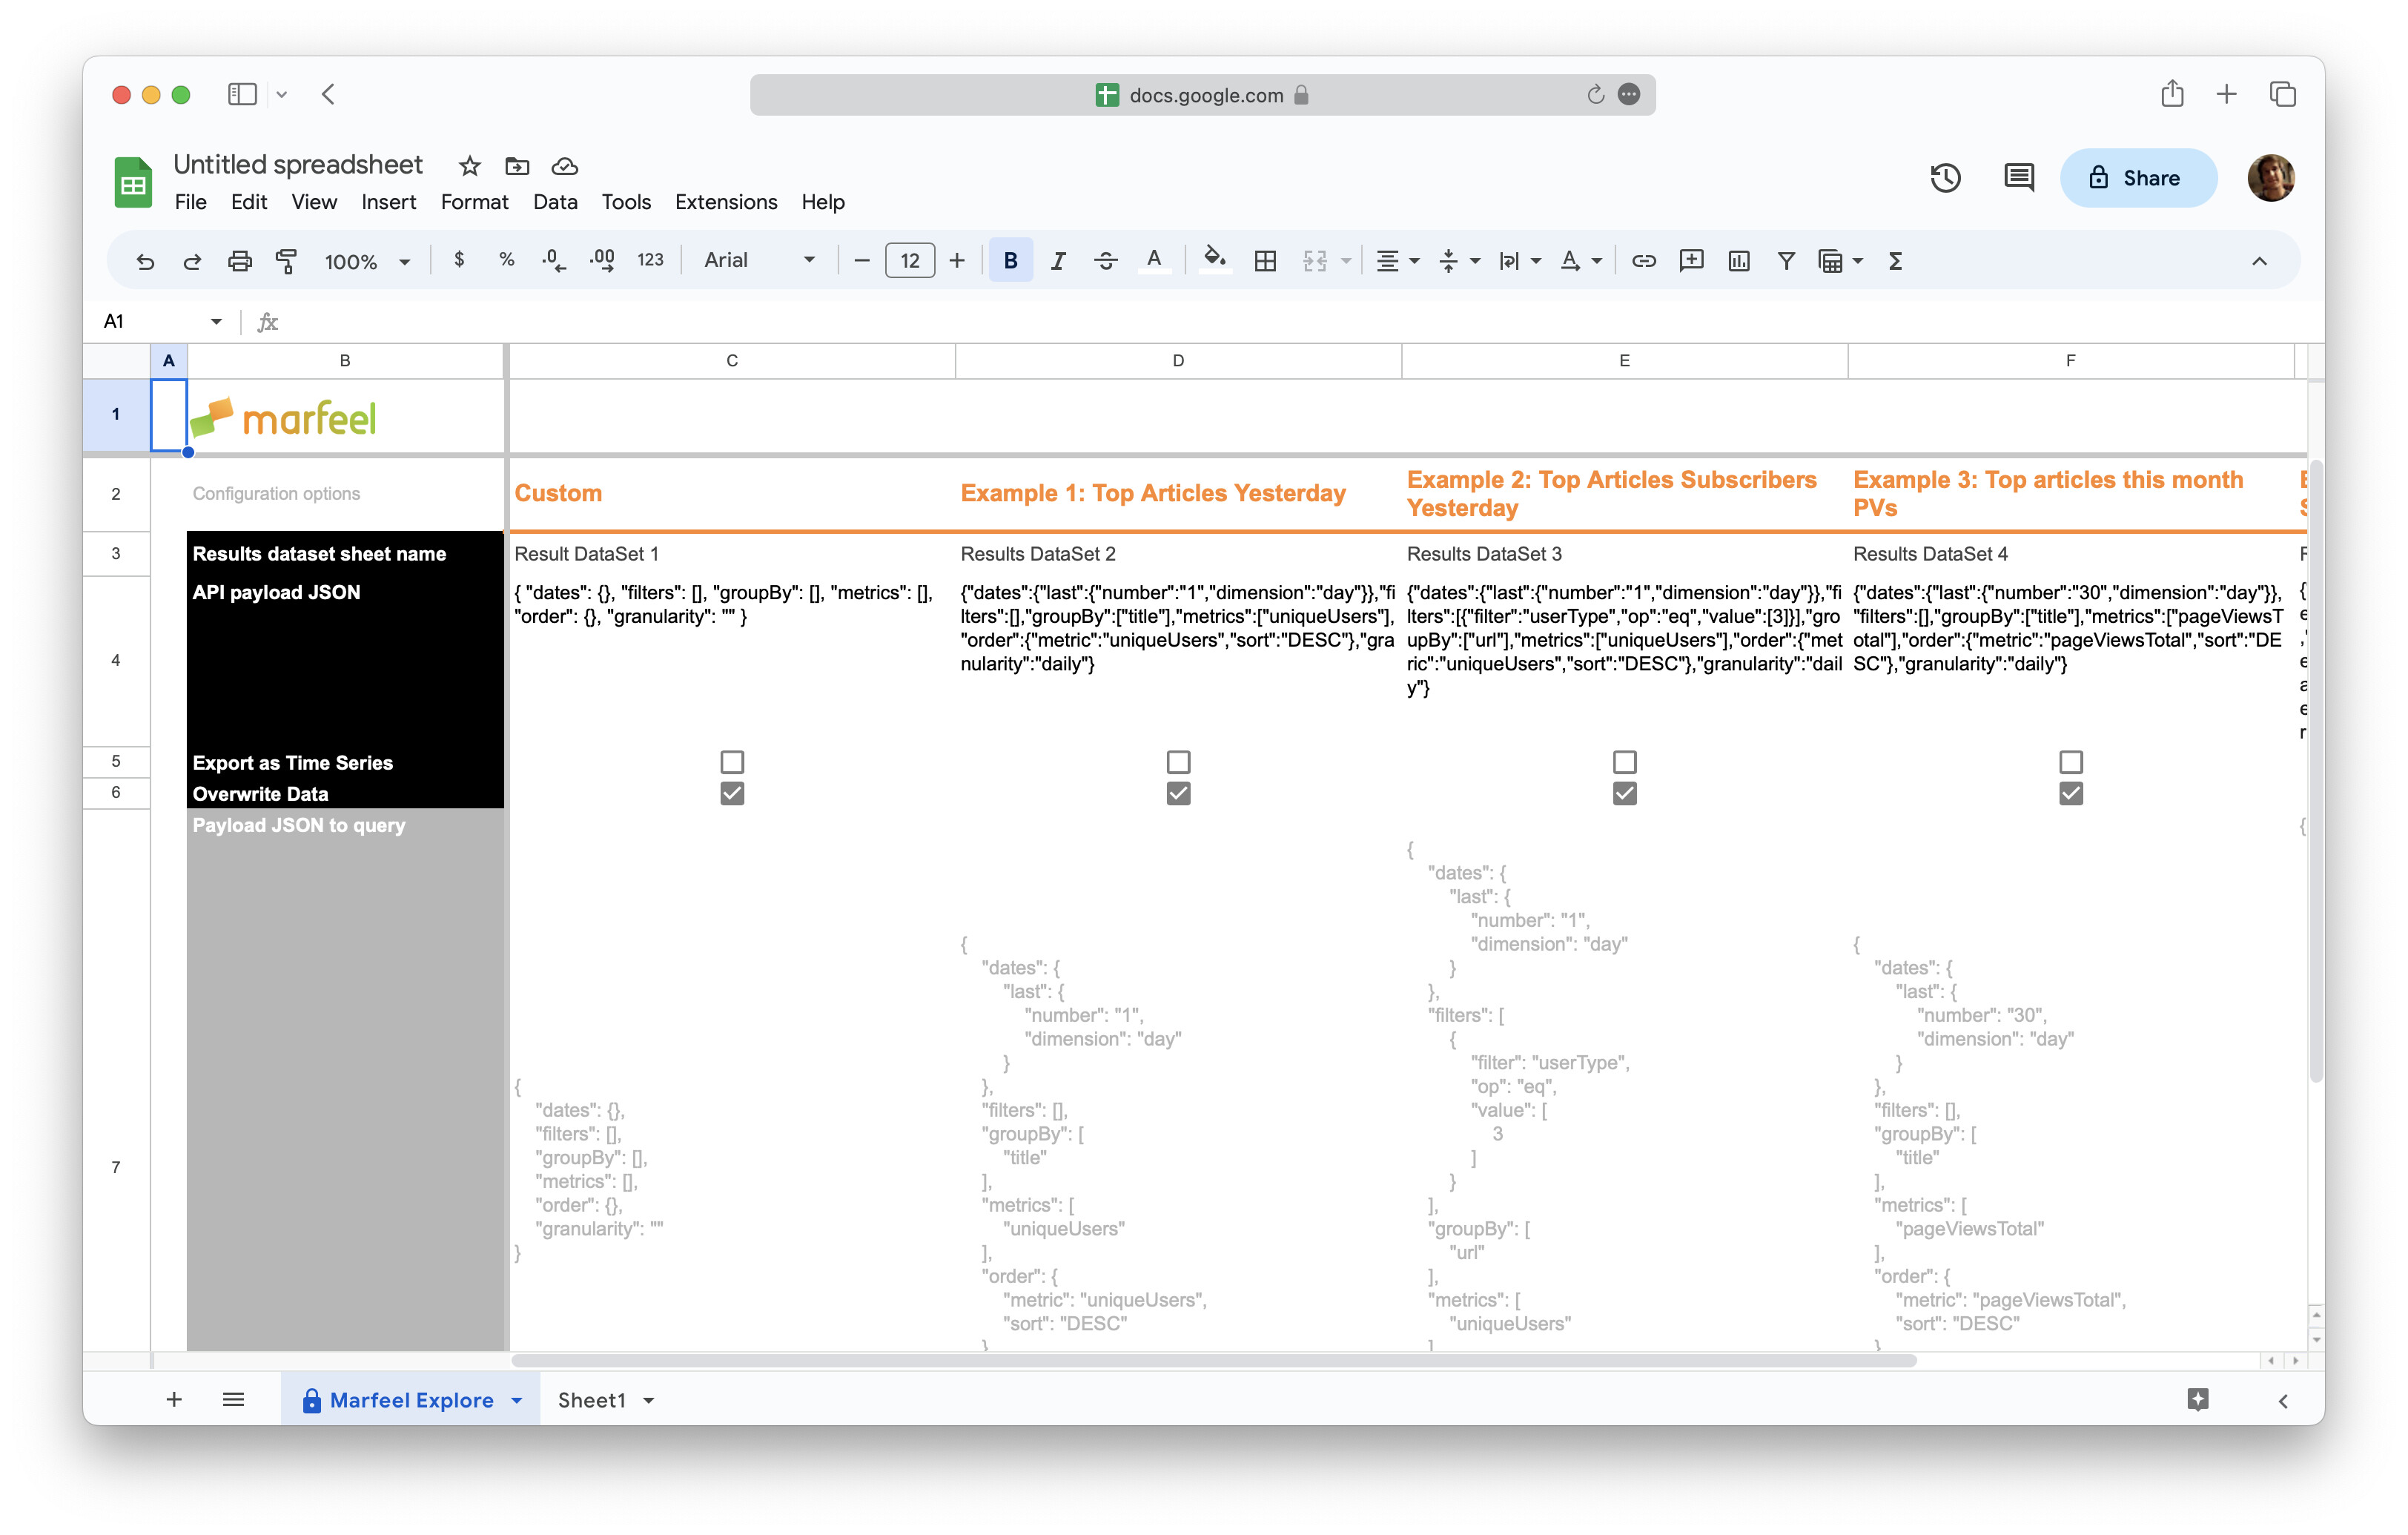
There are 5 rows:
- Report name: remember which report is in each column
- Results dataset sheet name: the name of the sheet where your results will appear for that report when it has been executed
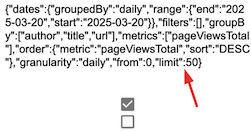
- API payload JSON: the query you want to run, in JSON format
- Export as Time Series: check this box if you want data to be split by hour, day or week, as shown in Explore view when expanding rows
- Overwrite data: keep this box checked if you wish to have old data overwritten when you execute a fresh report
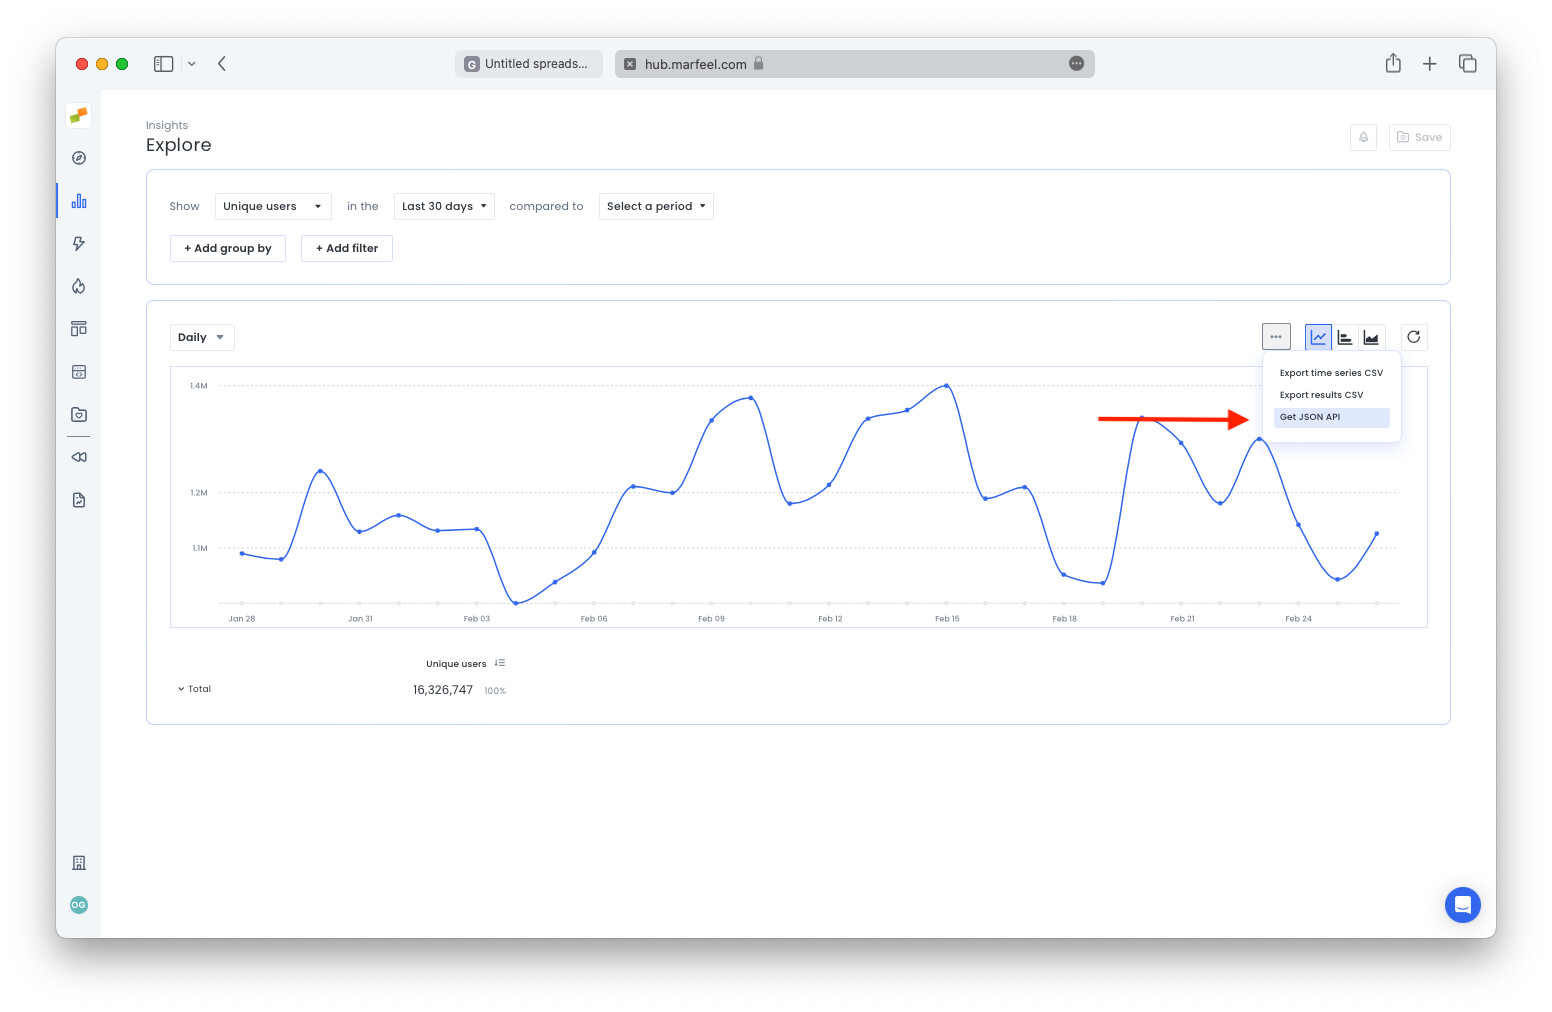
Get JSON API for query
To import a query into your sheet, go to Explore and run the query you want.
- Click the three dots in the top-right corner
- Click
Get JSON API
- The query will copy to the clipboard
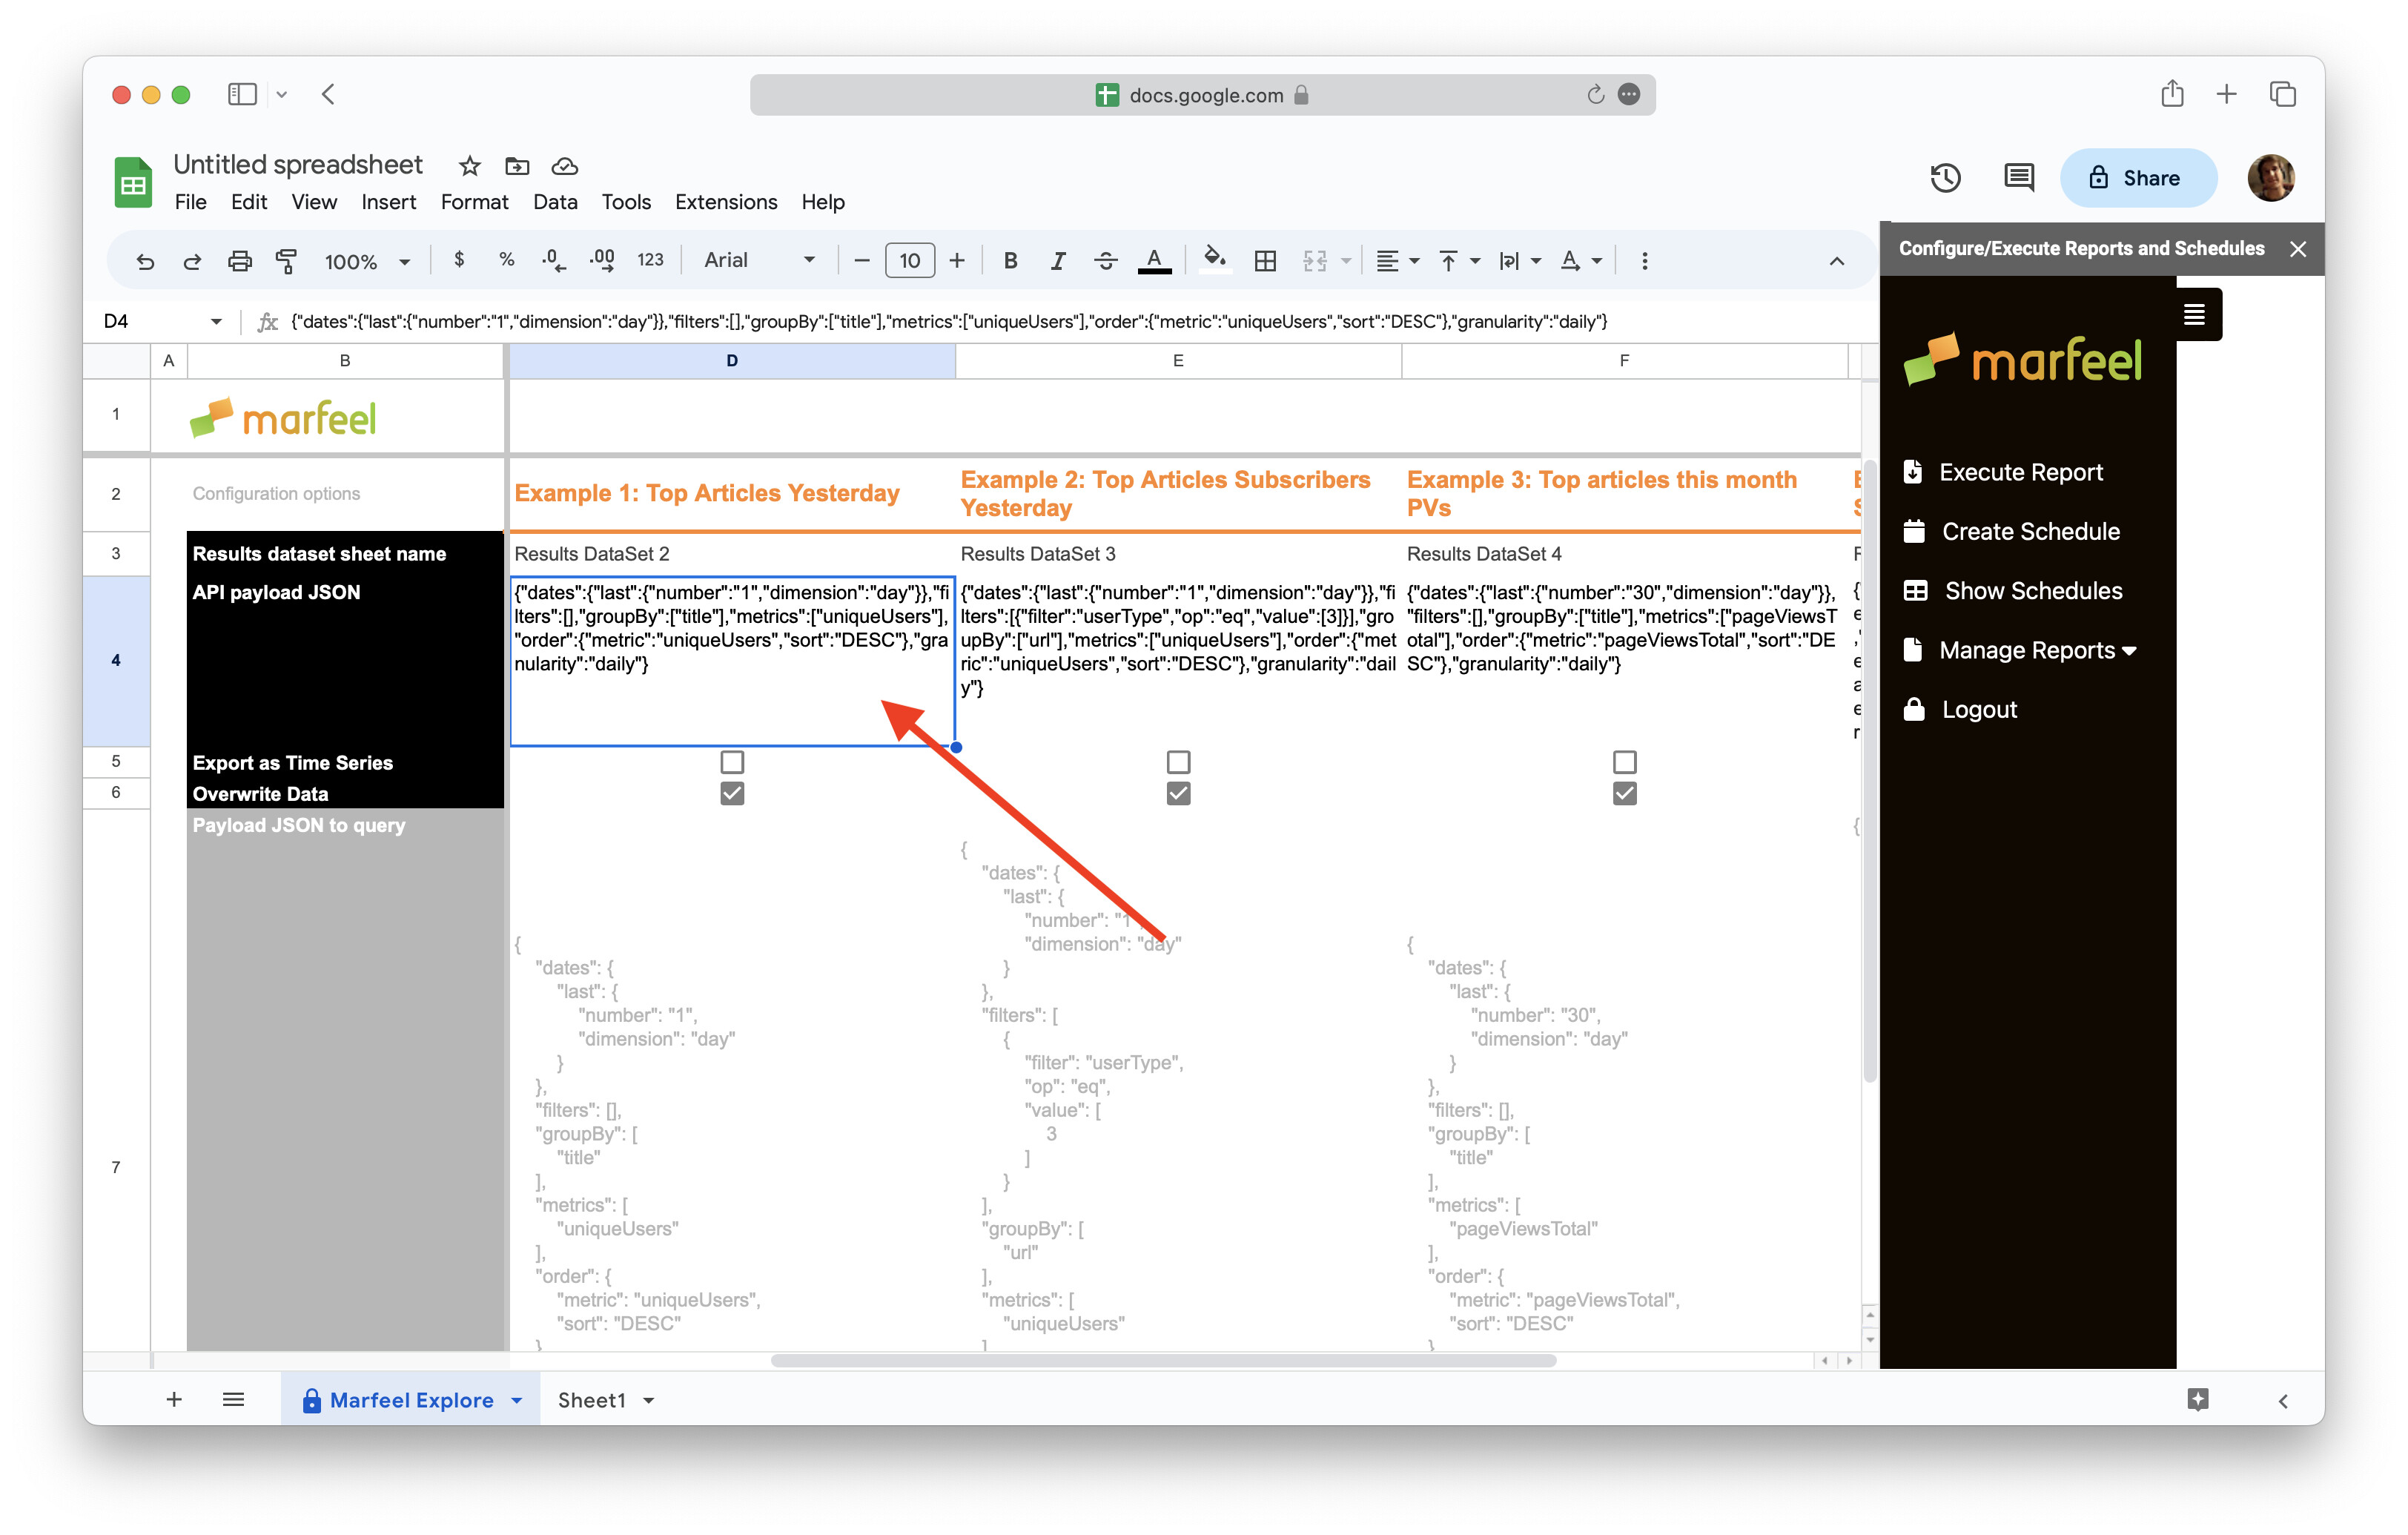
- Go back to your sheet and paste the query in the API payload JSON row, in the column you want to edit the report for
- Optional: Rename the report name on the second row to better describe the query
- Optional: Rename the Results data sheet name row with the name you want to give to the sheet where the data will populate once the report has been executed.
Execute report
To generate any Explore report in sheet form, select Execute report from the sidebar.
Note: if at any time the sidebar disappears, go to Extensions > Marfeel for Google Sheets > Open Report API
- Click on
Execute reportin the sidebar - Select the report from the dropdown menu and click outside the menu to collapse it
- Click the green
Execute reportbutton - If you have the Overwrite data option checked, you will be prompted to confirm that you wish to delete existing data. Click
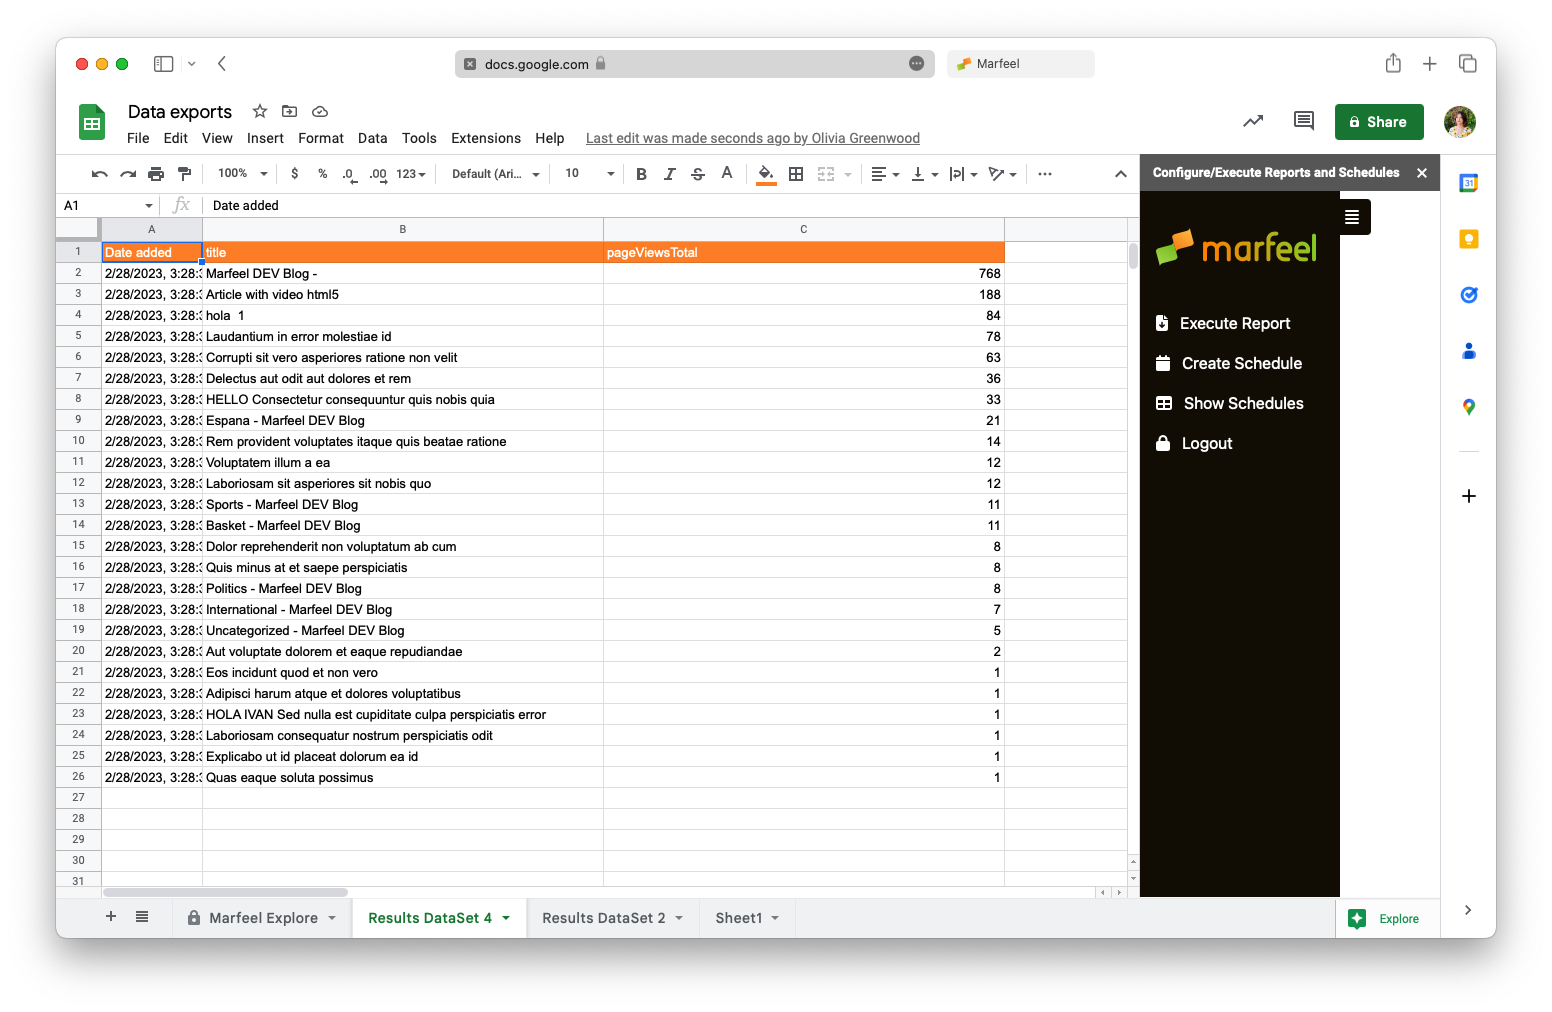
Yesto proceed. - It might take some seconds for the process to be completed.
- The data will populate in a sheet with the name provided in the second row of the Custom column.
- If you have opted NOT to overwrite historical data, i.e. the checkmark on the main sheet is unchecked for that dataset, then the data from previous reports will appear below the more recent data.
Schedule reports
Schedule reports to have the delivered right to the sheet automatically at regular intervals to create routines and always be in possession of the freshest data.
- Select
Create Schedulein the side panel. - Select the report you want to schedule from the
Reportsdrop-down menu - Choose how often and when you want to receive reports. You can set a recurrence daily, weekly or monthly, and setting the exact execution time is also available.
Alternatively, select the date and time you’d like to schedule a one-off report on.
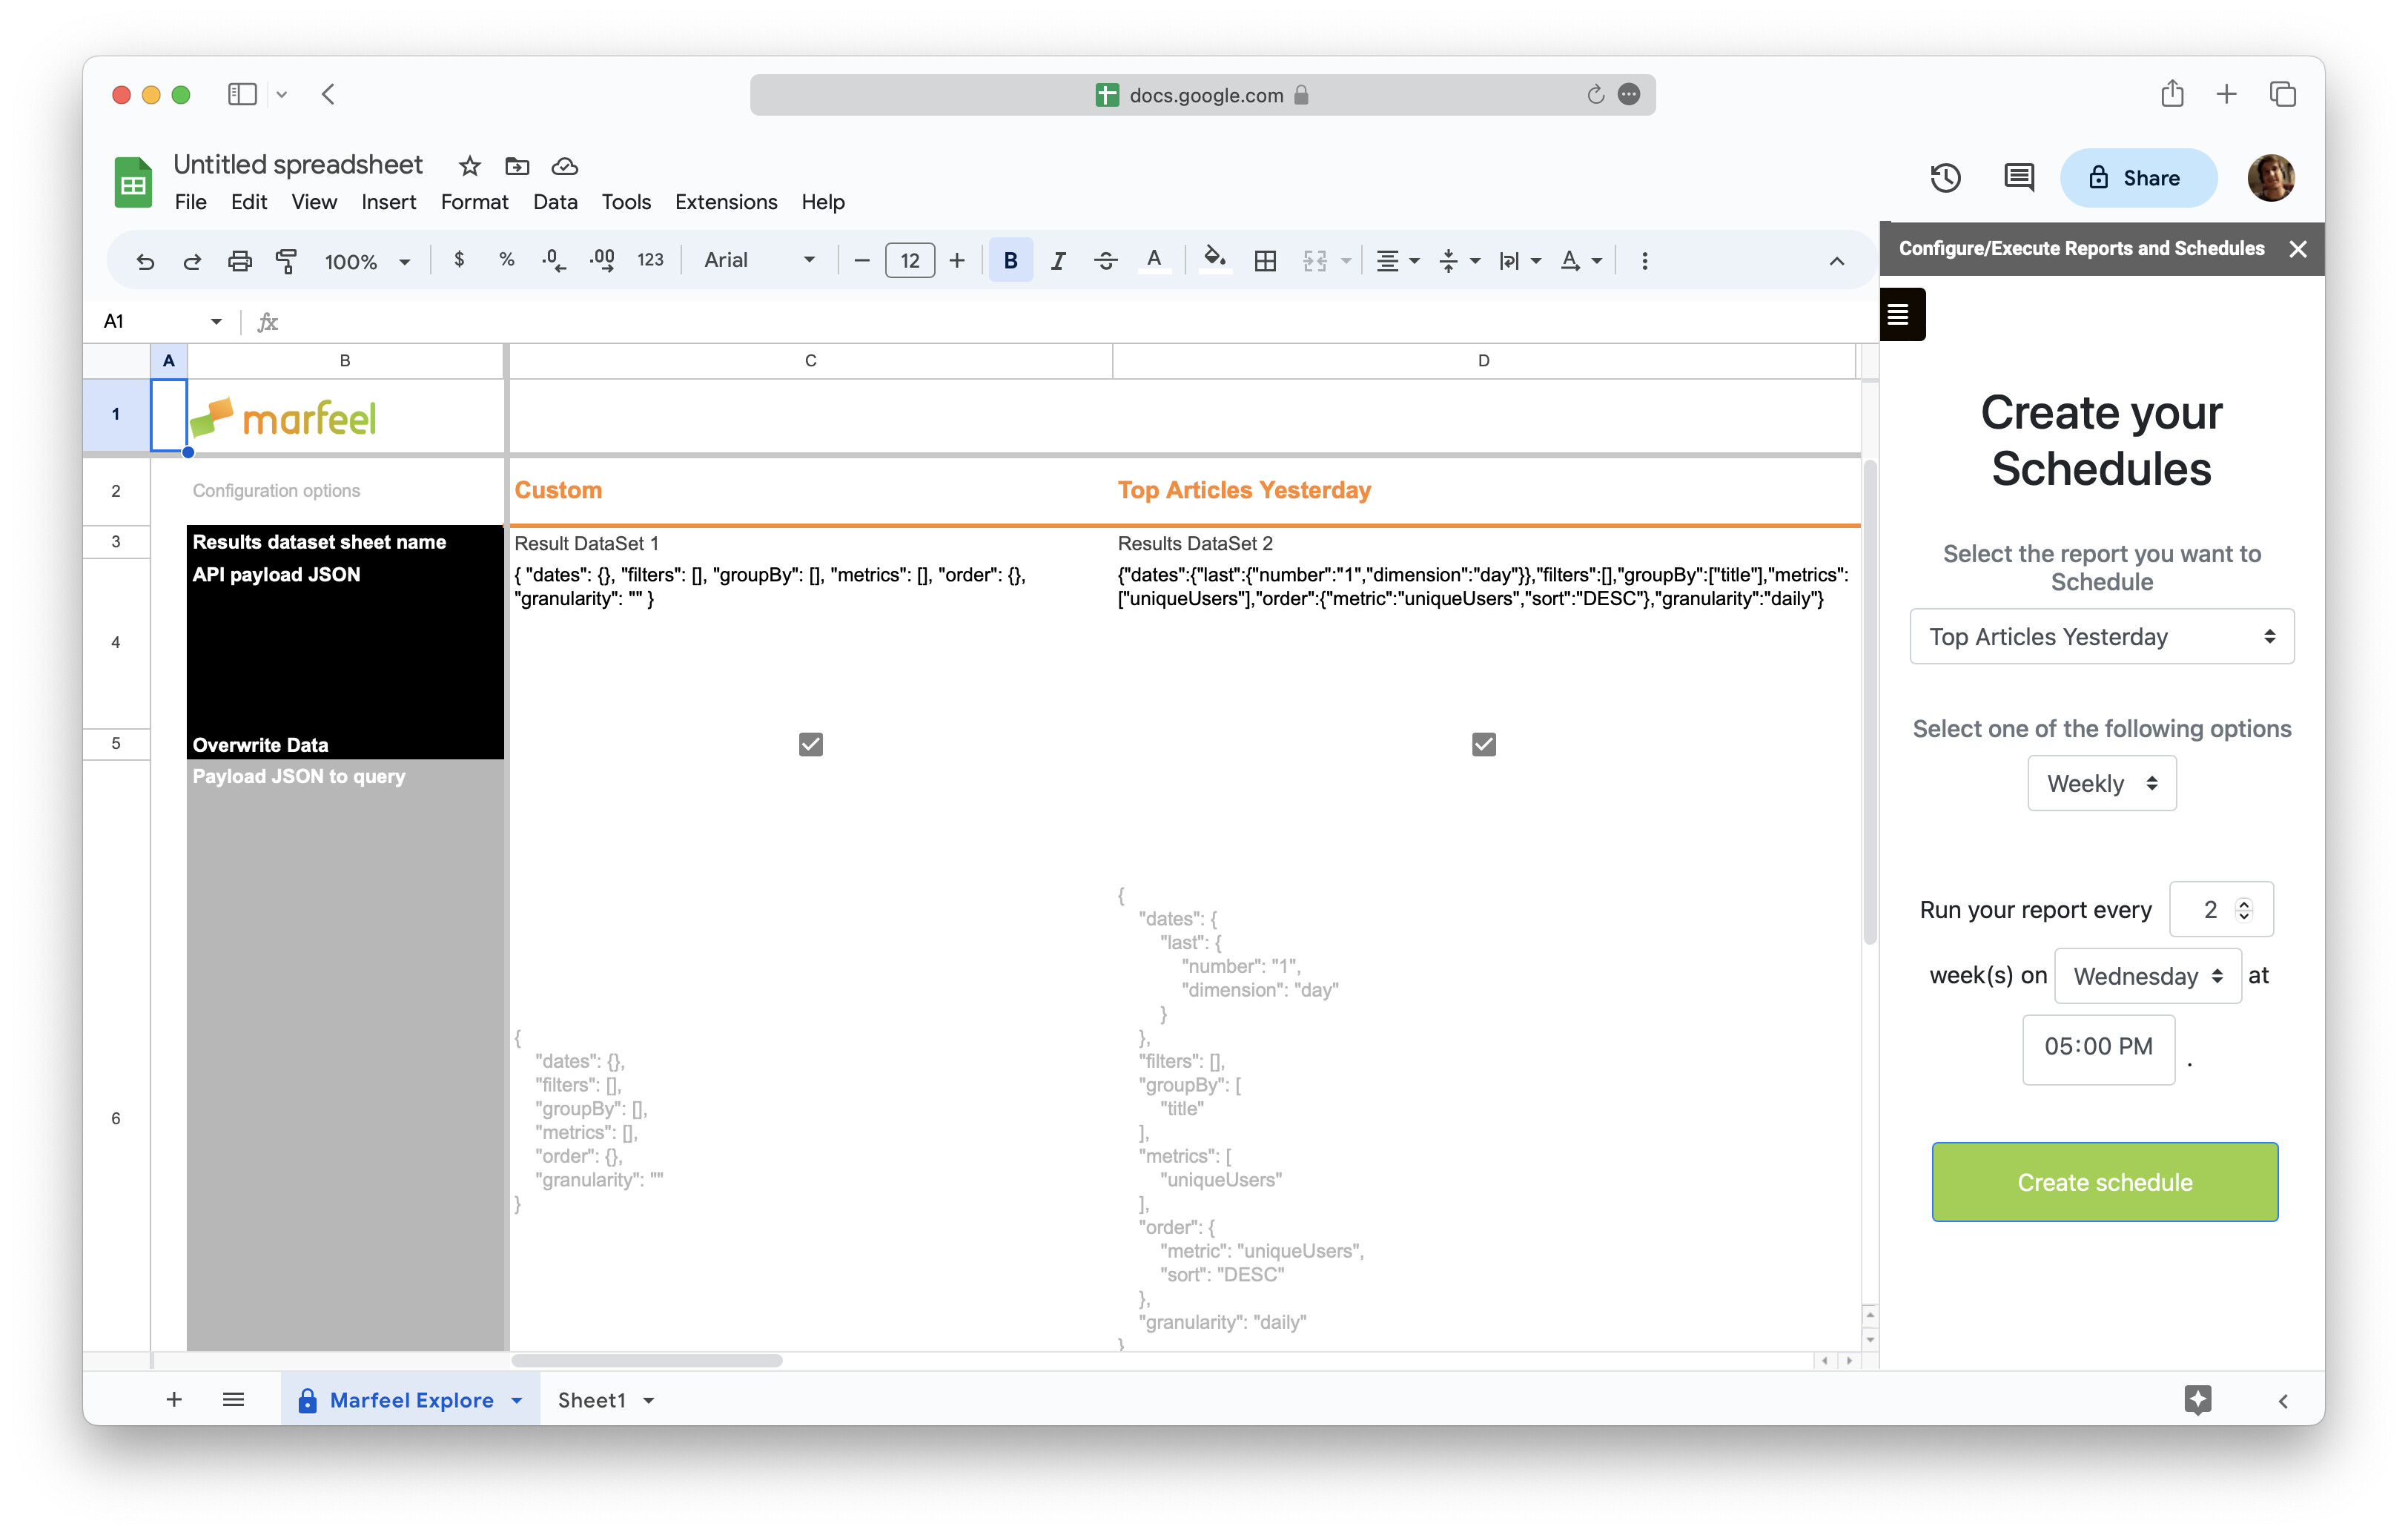
- Click on
Create schedule
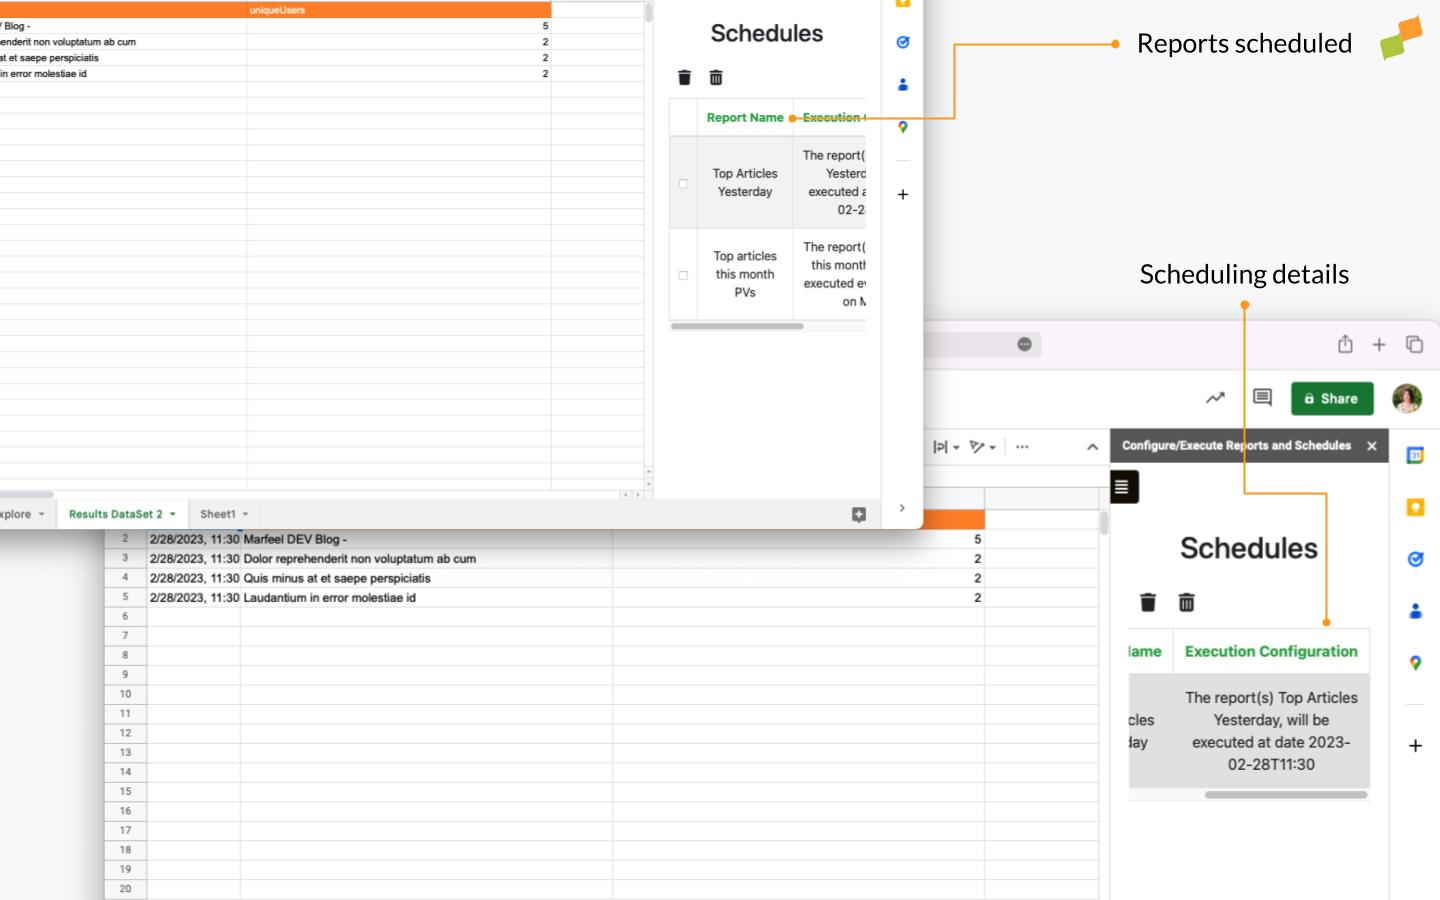
View scheduled reports
Select Show Schedules from the sidebar menu to see the reports that you have scheduled previously and the scheduling information. Select any report to delete it or select the trash icon on the right-hand side to cancel all subscriptions.
Troubleshouting
Session or Credential Errors
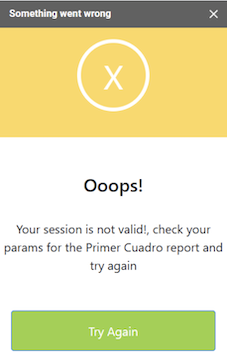
If you receive an error Your session is not valid, it typically indicates an issue with user credentials or an expired token. To resolve it, log out of your account and log back in to refresh your session and update your token.
Row Limit in Reports
By default, reports are limited to 50 rows. If you need to retrieve more data, manually increase the row limit in the JSON configuration of your report.
Pivot Table Export Not Supported
Direct export of reports as Pivot tables is not supported. To create a Pivot table, first export the unpivoted report, then use Google Sheets to convert it into a Pivot table.
Incorrect Cell Formatting in Exported Data
Before exporting data, make sure the target sheet has the default cell format applied.
If cells in your sheet have been previously formatted (e.g., as dates, currency, etc.), they will retain those formats after the export.