With Discover monitoring, you’ll be able to visualize what content is trending on Google Discover all over the world filtering by country, language, city, topic, publisher, and time period.

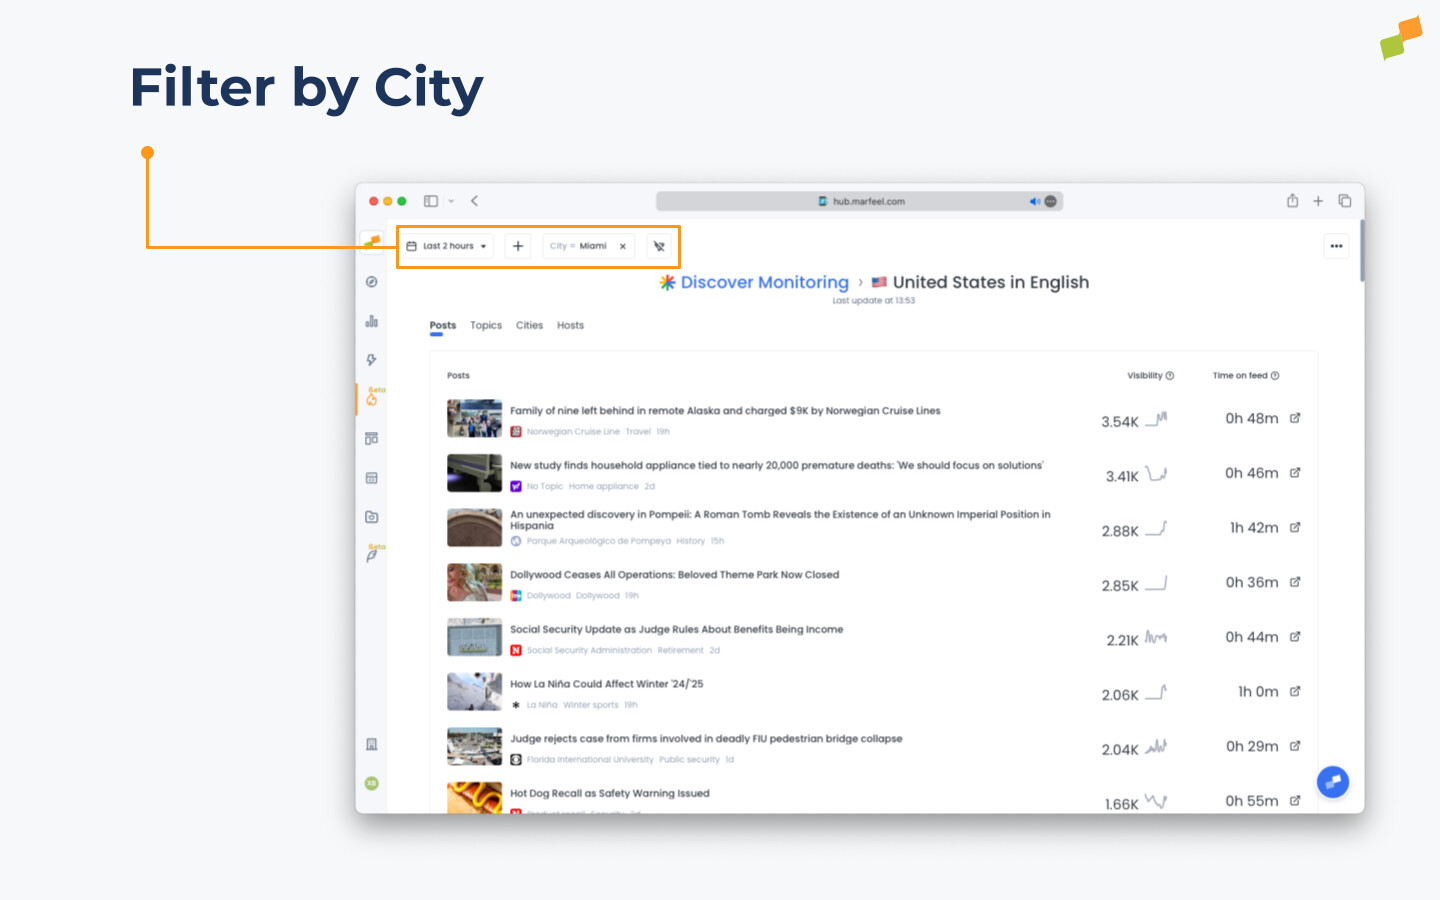
You can track high level trends at a country-level in the present, or get super specific and look at what was performing in a single city like Miami during a specific timeframe.
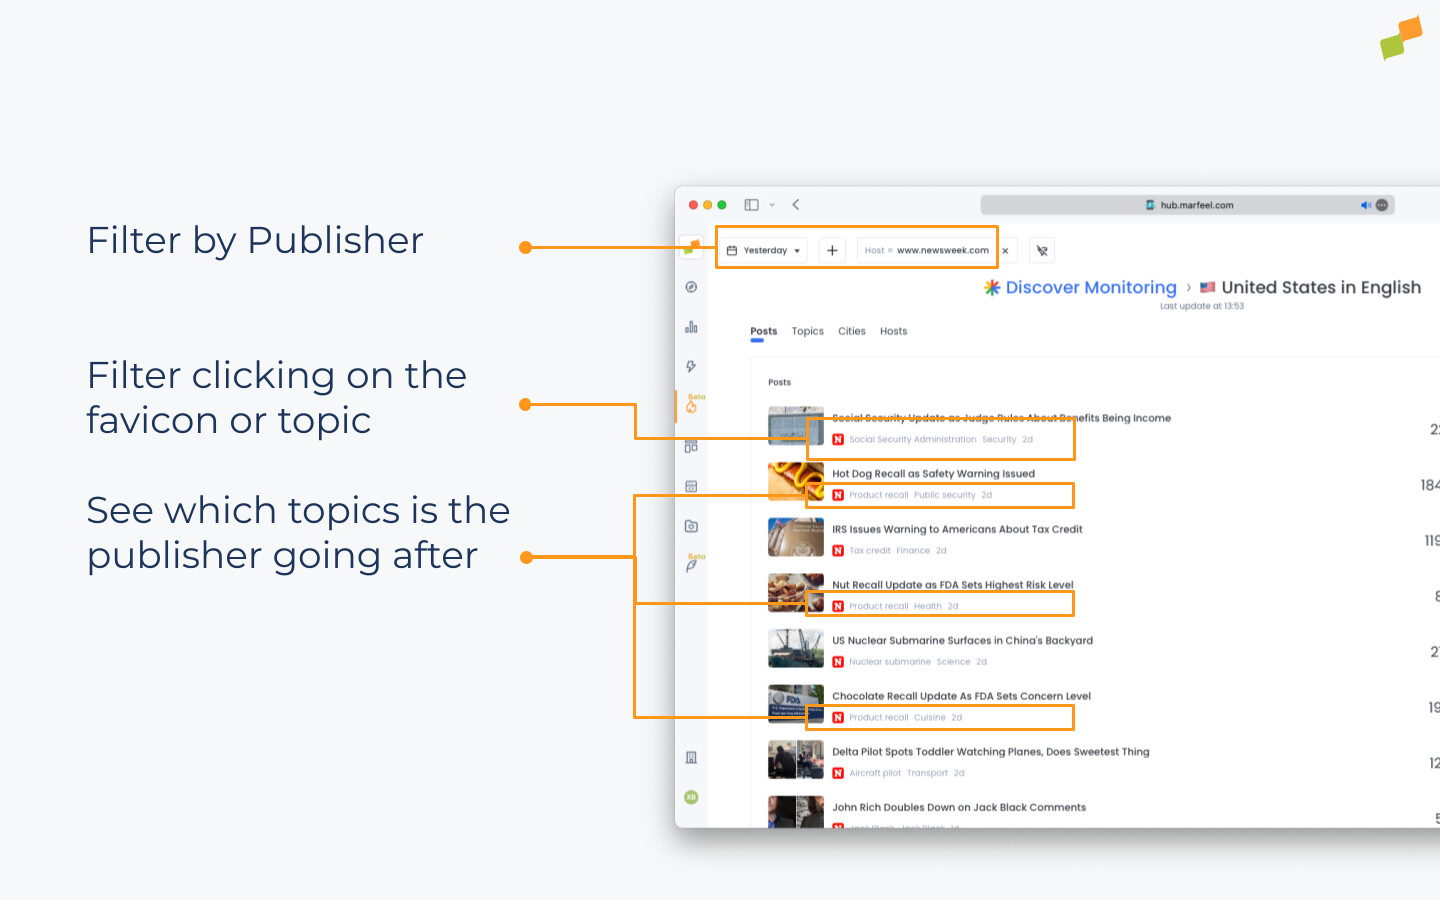
Furthermore, you can delve into the data of specific competitors, to understand the stories and topics that are performing for them and take action. As you can see here, this publisher seems to have hit on something with food and product recalls.
With this kind of data at your fingertips, you can drive real time tactical changes, like jumping on a hot topic and getting something out there to ride the wave, but you can also make bigger strategic decisions, like using long-term trends to detect gaps in your evergreen content that can win you more traffic.
Become a Marfeel Monitoring expert
Learn how to track trends, benchmark performance, and react in real time with our Marfeel Monitoring Course.
Actionable insights
![]() Start now on Marfeel Academy.
Start now on Marfeel Academy.
Filtering
- Host: Use this filter to narrow your Discover Monitoring results based on media organization. Only want to see data from The New York Times? Set that host filter.
- Topic: Use this filter if you’re looking to analyze a specific topic. Want to know what articles about the Olympics are performing best on Google Discover? Use the topic filter.
- Category: Use this filter if you’re looking to analyze a full category like sports or finance, or to deep dive into a more specific category like basketball or restaurants.
- City: This filter is especially useful for regional publishers. A story may be relevant in Boston but not in Seattle.
- Article publish date: Want to analyze stories on Google Discover published during a certain time period? With this filter, you can.
- Date picker: Adjust the time window you want to analyze.
- YouTube channel: Filter your feed to see posts from specific YouTube channels appearing on Google Discover
- isAI: Filter your feed to see only posts that appear as AI Summaries on Google Discover
Sections
- Posts: This view shows you posts ranked by their Visibility on Google Discover over your selected timeframe. You will see the Visibility and Time on Feed metrics. Posts with AI Summaries are clearly labeled, showing whether the click plays a YouTube, goes to X or to a publisher, along with the logos Google shows as sources.
- Pro tip: Clicking on the post title will take you directly to that article, where you can use CoPilot to perform competitor analysis and learn more about why it’s having success
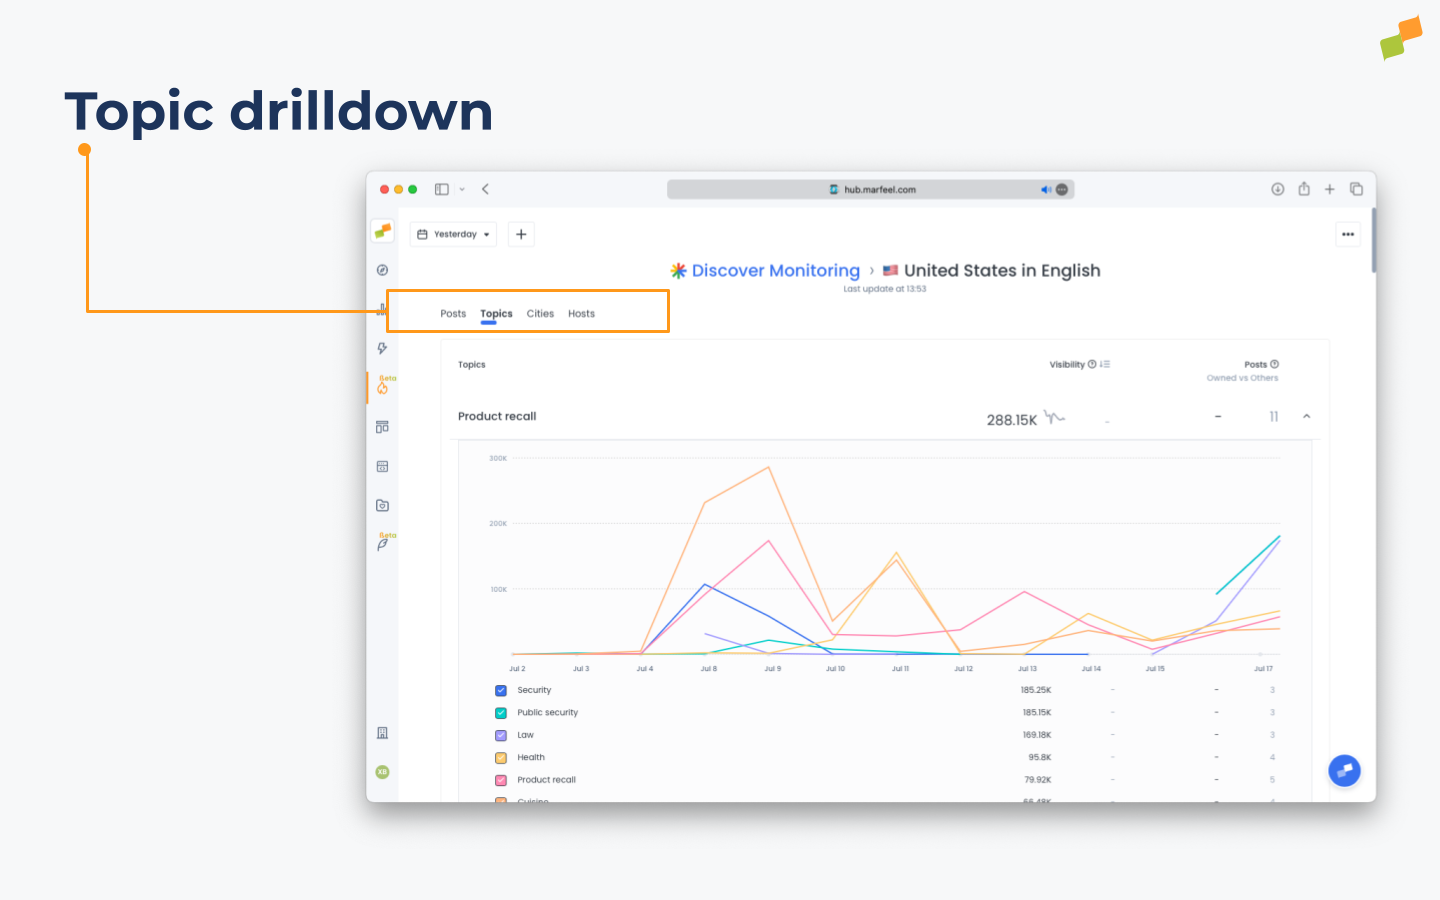
- Topics: This view shows you topics ranked by their Visibility on Google Discover over your selected timeframe. You will see the Visibility and Posts metrics, and you will also be able to see the number of your posts vs. the number of other publishers’ posts per topic. In addition, if you select a topic, you will see the most popular sub-topics related to the main topic and a chart showing the visibility of those sub-topics over time.
- Cities: This view shows the share of voice (visibility) per city. Very useful to benchmark the regional strategy when filtering one concrete domain. e.g. Filter The New York Times and see their distribution on a city by city basis. Double filter by city and you will see which topics are working for a given publication in a given region.
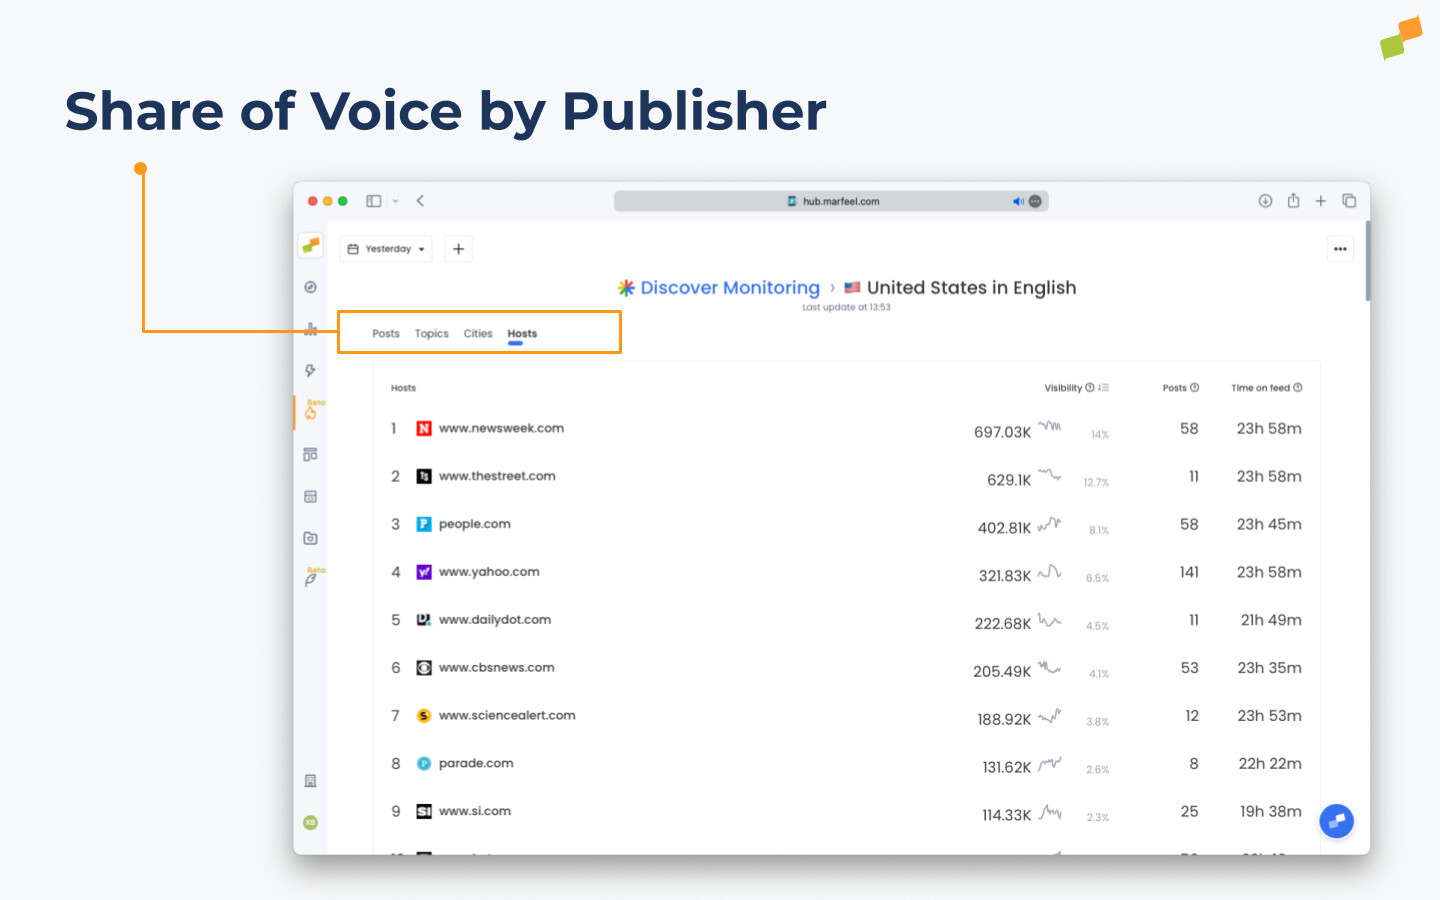
- Hosts: This view shows you hosts ranked by their Visibility on Google Discover over your selected timeframe. You will see Visibility along with a Share of Voice percentage as well as the Posts and Time on Feed metrics.
- Categories: Google classifies the content not only by topics but by content categories, this information is extracted by Google and it allows you to see what categories have more visibility.
- YouTube Channels: This view shows you YouTube channels ranked by their Visibility on Google Discover over your selected timeframe. You will see the visibility share per channel, number of videos surfaced per channel, and which are the winning contents per channel. Track how often YouTube appears in the feed and whether videos are referenced from AI Summaries
AI Summaries
AI Summaries now represent a significant portion of Google Discover content in key markets. In the US, Brazil, and Mexico, 51% of the feed consists of AI Summaries. These summaries often display multiple publisher logos but provide a single actionable click, which in most cases plays an inline YouTube video
With Marfeel Discover Monitoring, you get full visibility into:
- Posts with AI Summaries, clearly labeled in your feed
- Whether each AI Summary click plays a YouTube, goes to X or to a publisher
- The logos Google shows as sources
- The winning YouTube channel or X account, with name and direct link
This helps you understand when your content is being referenced and when the value flows elsewhere, allowing you to benchmark performance, spot emerging trends, detect traffic displacement early, and adapt editorial and growth strategies before traffic drops show up in analytics
Learn more about Google Discover’s shift to AI, YouTube, and X in our complete report