Align your teams and move faster by focusing on a common, concrete set of metrics. Every workspace is just one click away from becoming a custom dashboard. Toggle from list to dashboard view to convert your workspaces into custom dashboards and have all the reports available at a glance.
Dashboards empowers teams to share complete context, dig into the data, and make better decisions together. Dashboards help you put top-priority tasks front and center repositioning and resizing reports in according to workflow and priority. Organize different dashboards around routines and tasks. For example:
-
Create a Google Discover dashboard with a report on topics positioned next to one on traffic in order to visualize both aspects of your strategy at the same time.
-
Set up a debugging dashboard with reports monitoring all your debugging efforts in order of implementation to track progress at a glance.
Convert workspaces into dashboards
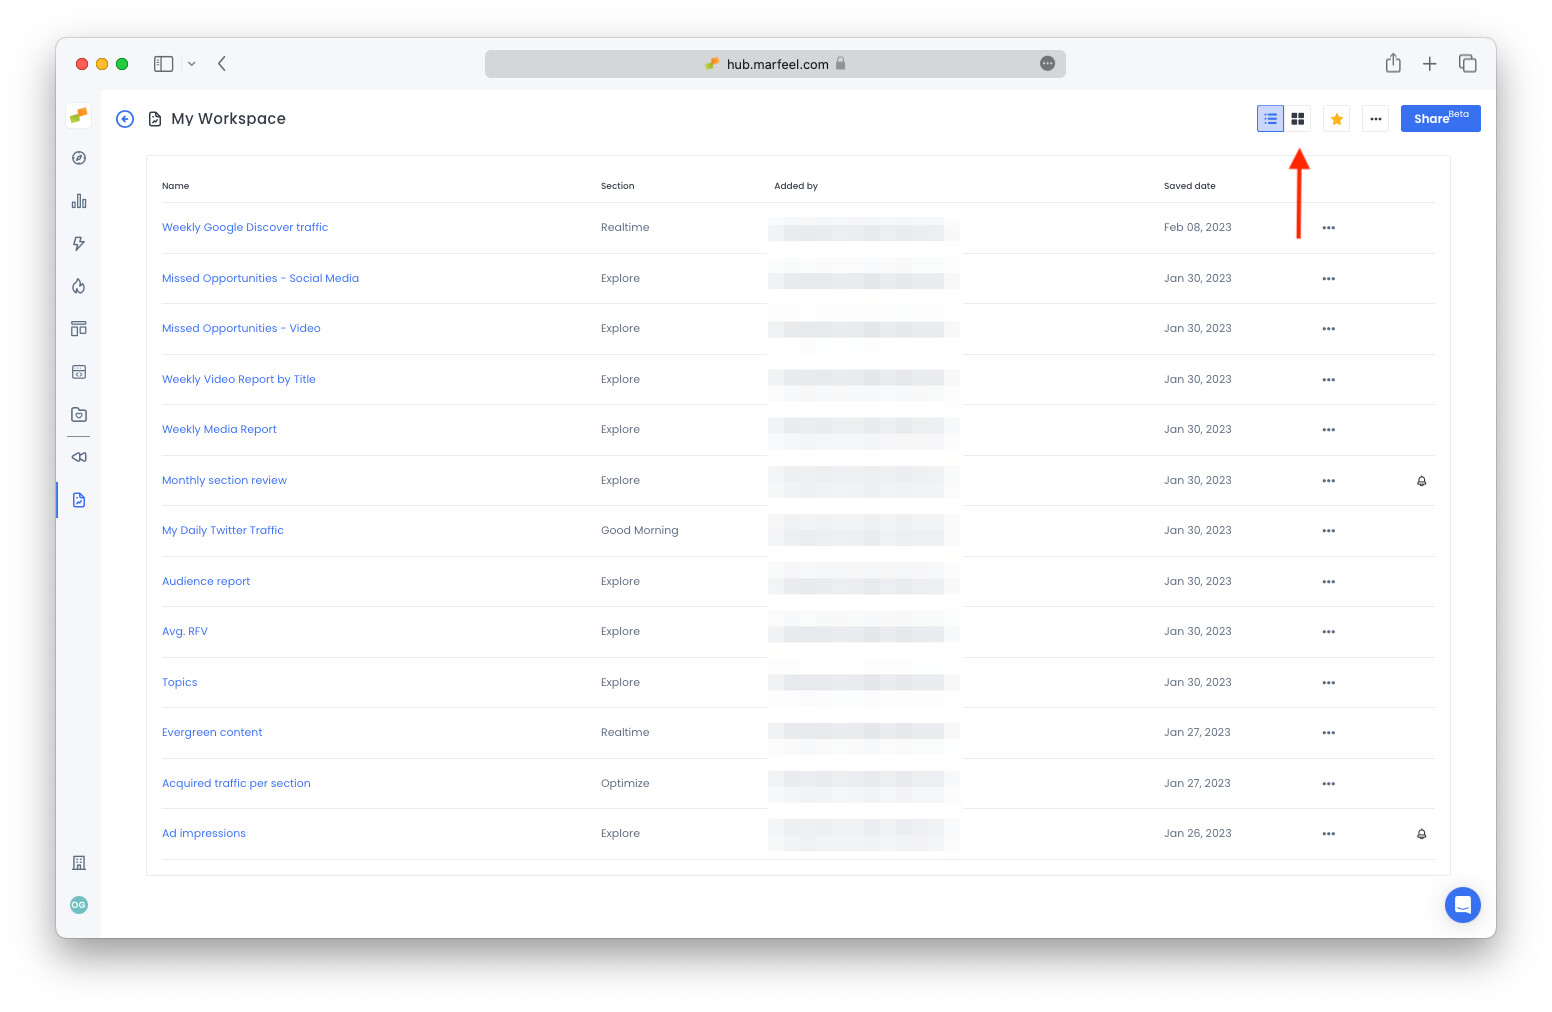
Toggle between list-mode and custom dashboards to enjoy the benefits of customizable, visual data.
-
From inside any workspace, click the dashboard button in the top-right corner to switch to dashboard view:
-
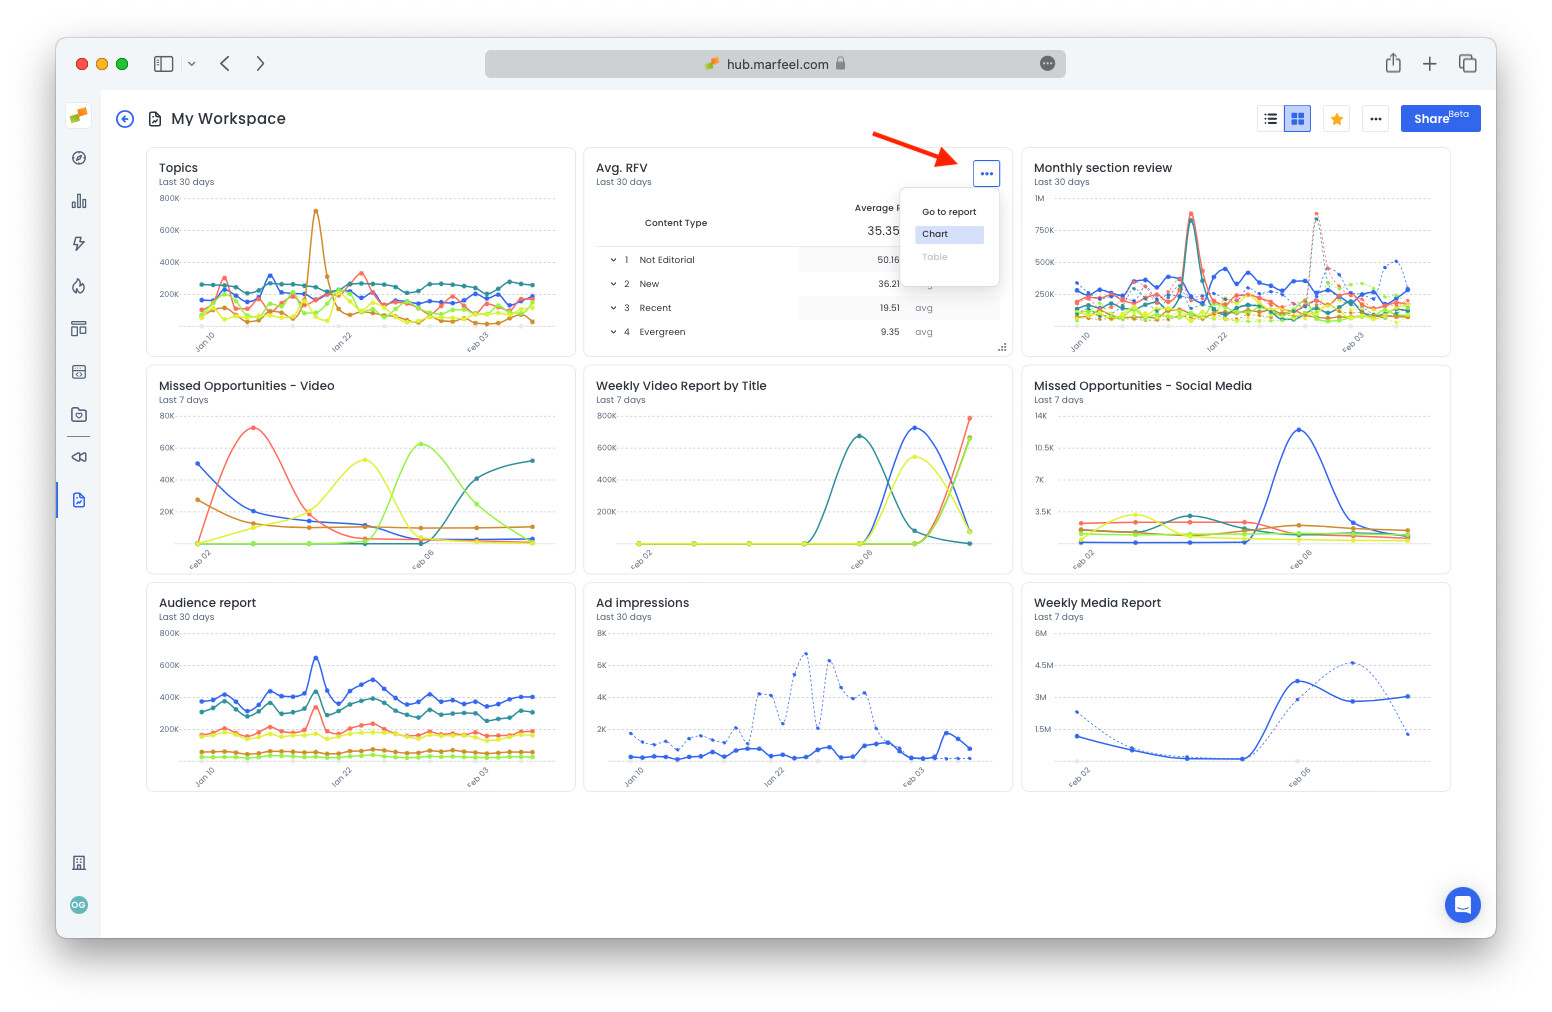
All the reports from the workspace are now visible. Click on the three points in the three points in the corner of any report to switch between
chartandtableview or selectGo to reportto open the original report.
-
Click on the bottom-right corner of any chart to drag & drop and resize
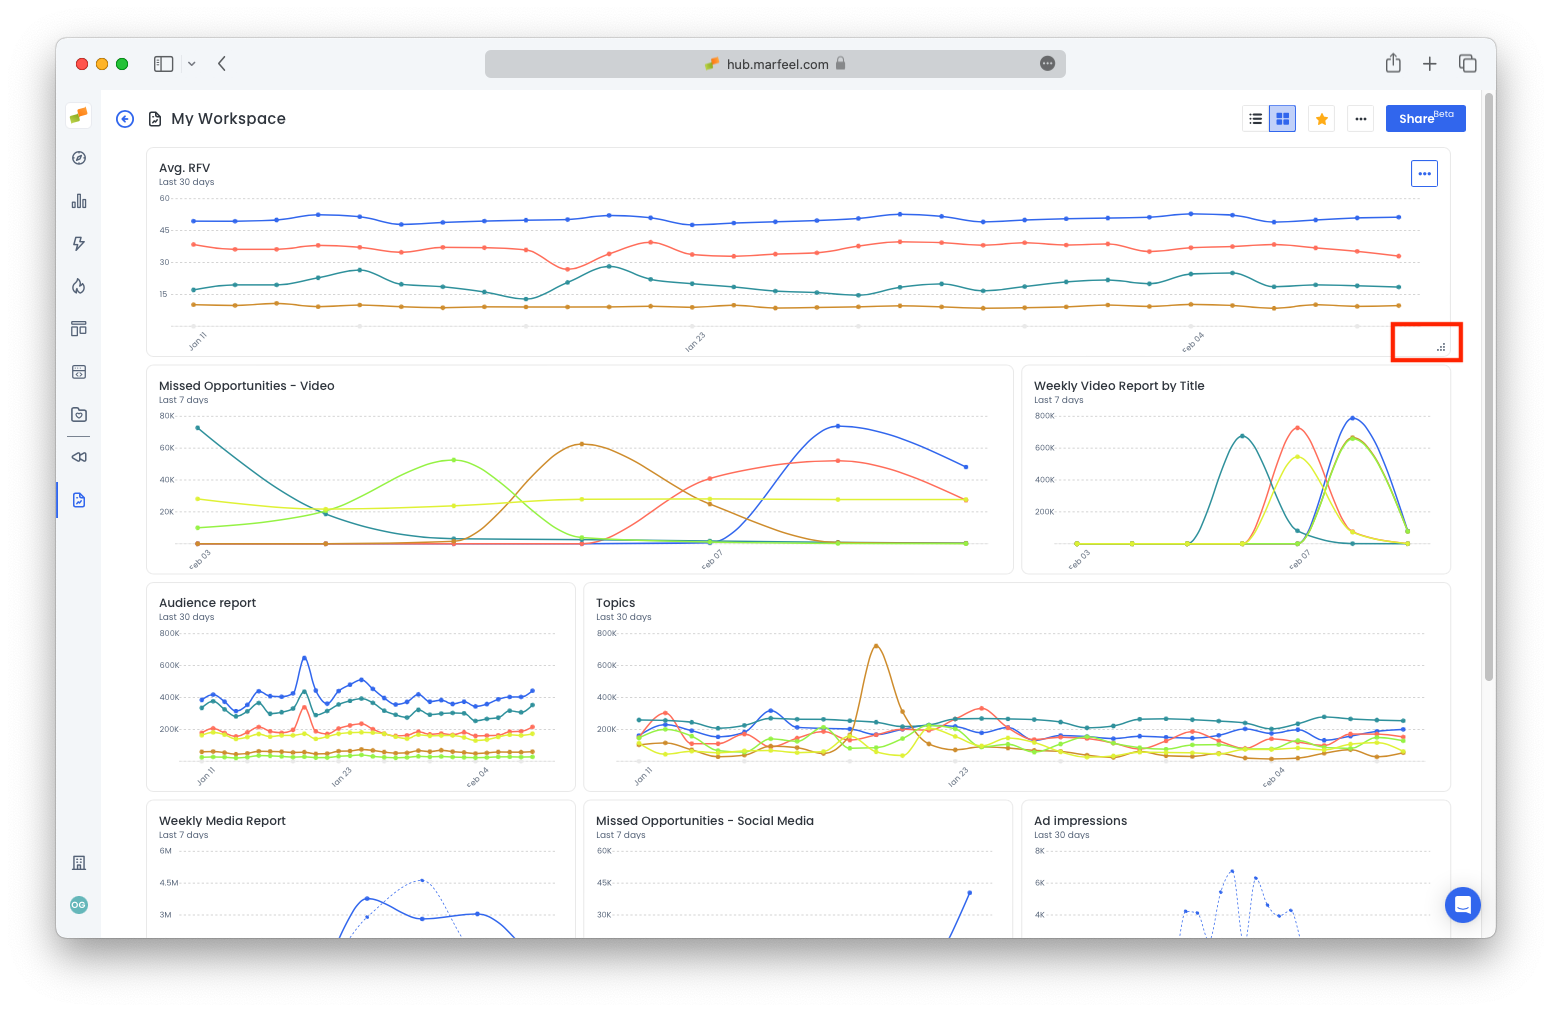
Click the list button to switch back to the list view: ![]()
Who can edit dashboards?
Creators and Co-owners of workspaces can make the adjustments described above to reprioritize or improve workflow. The changes are applied across all accounts for anyone with access to that dashboard. This makes it easy to align as everyone is looking at the same layout.
Workspace Viewers cannot make changes to dashboards. Learn more about sharing workspaces.