These past weeks we’ve been hard working improving the Explore view to provide more advanced reporting when comparing different time frames and making saved reports more useful with relative time frames.
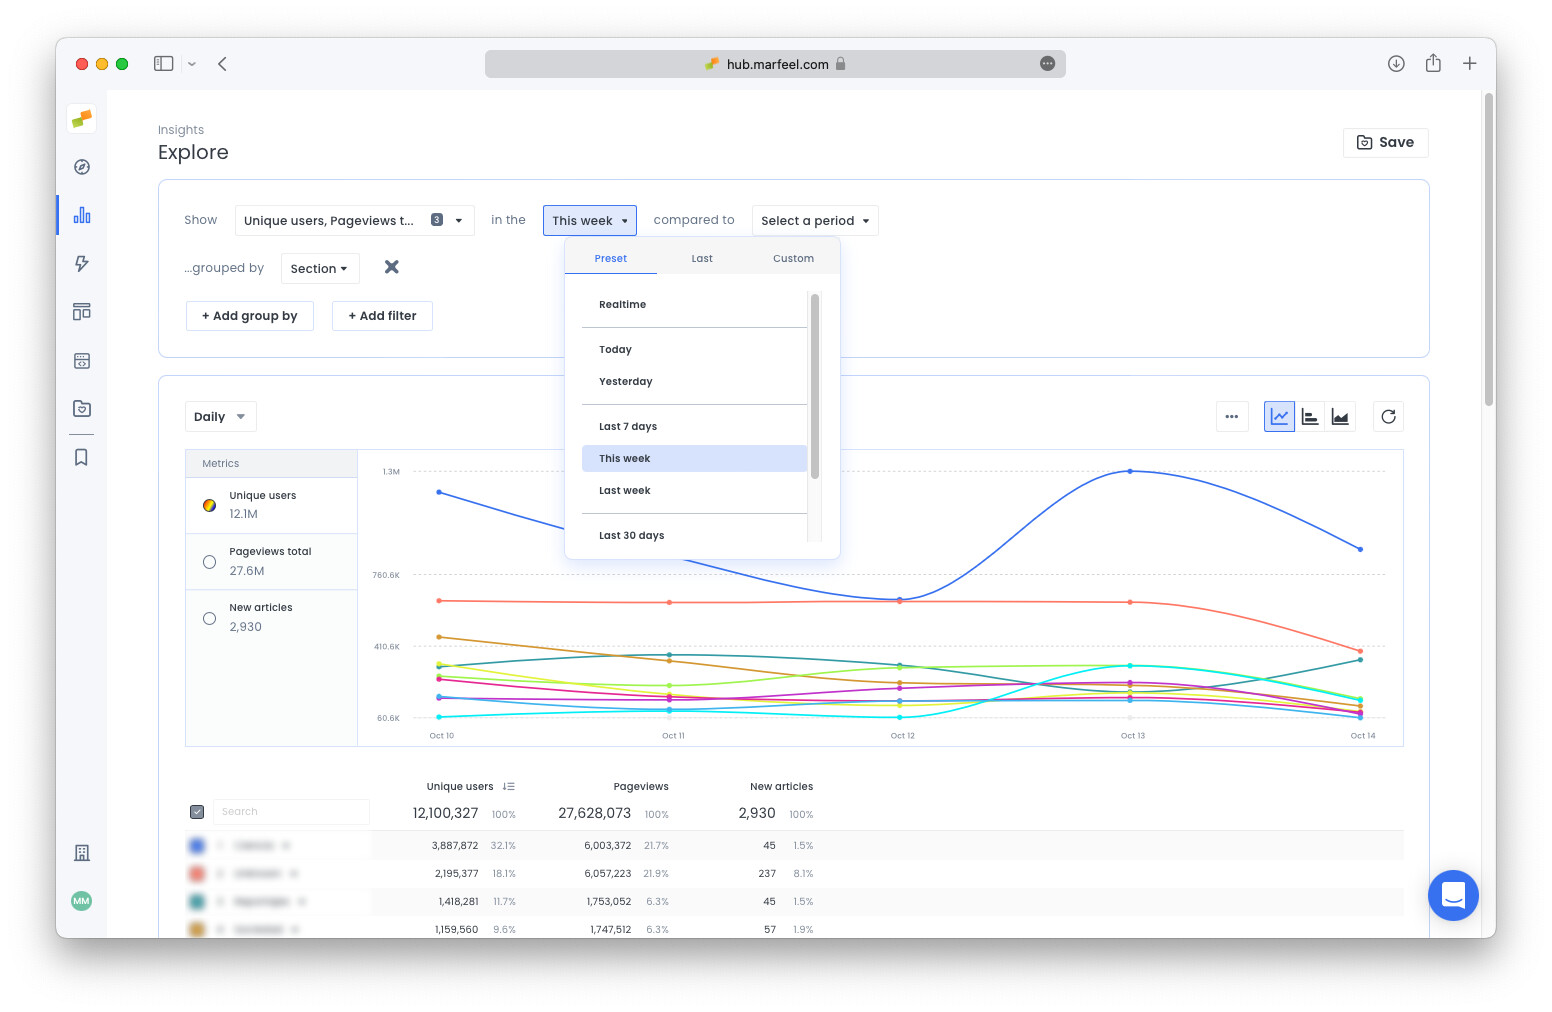
- New date selector with convenience presets like
this week,this monthorlast month. These presets come in handy when using saved reports so you don’t have to constantly update the dates of the report.
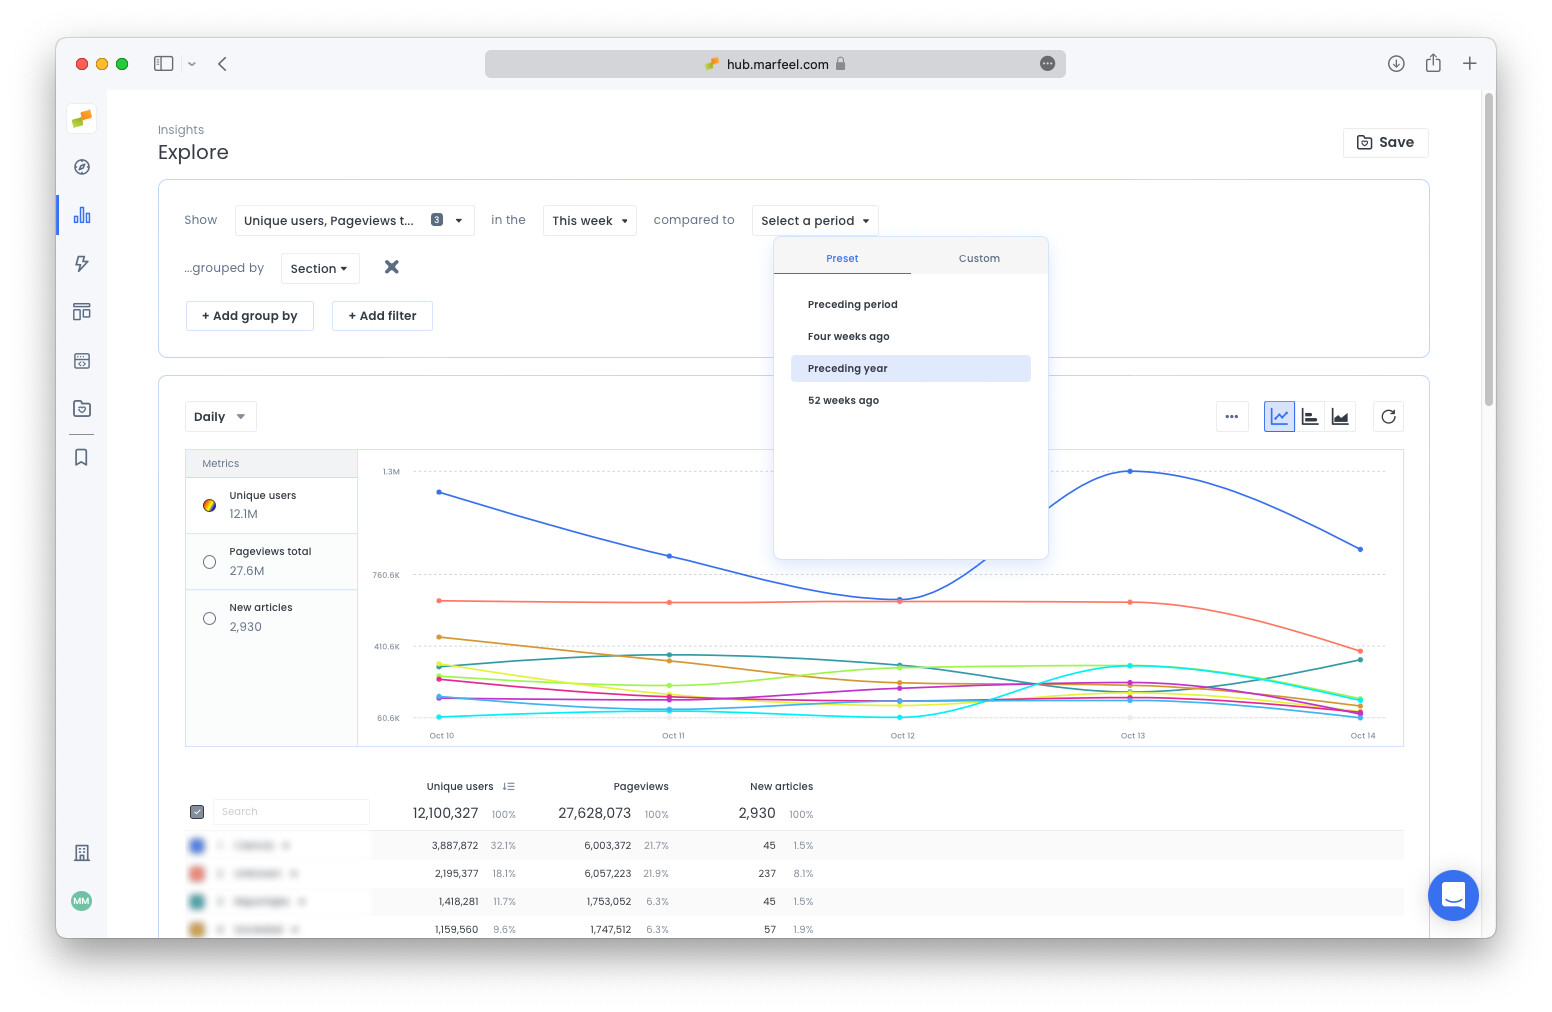
- We’ve also added presets for more precise comparisons. Some examples:
- Select
This month excluding todayand compare toPreceding periodto compare the ongoing month with the same days of the previous month. This will help you understand how well are you doing compared to the previous month - You can do the same comparing to
Preceding yearto compare your YoY (year-over-year) growth.
- Select
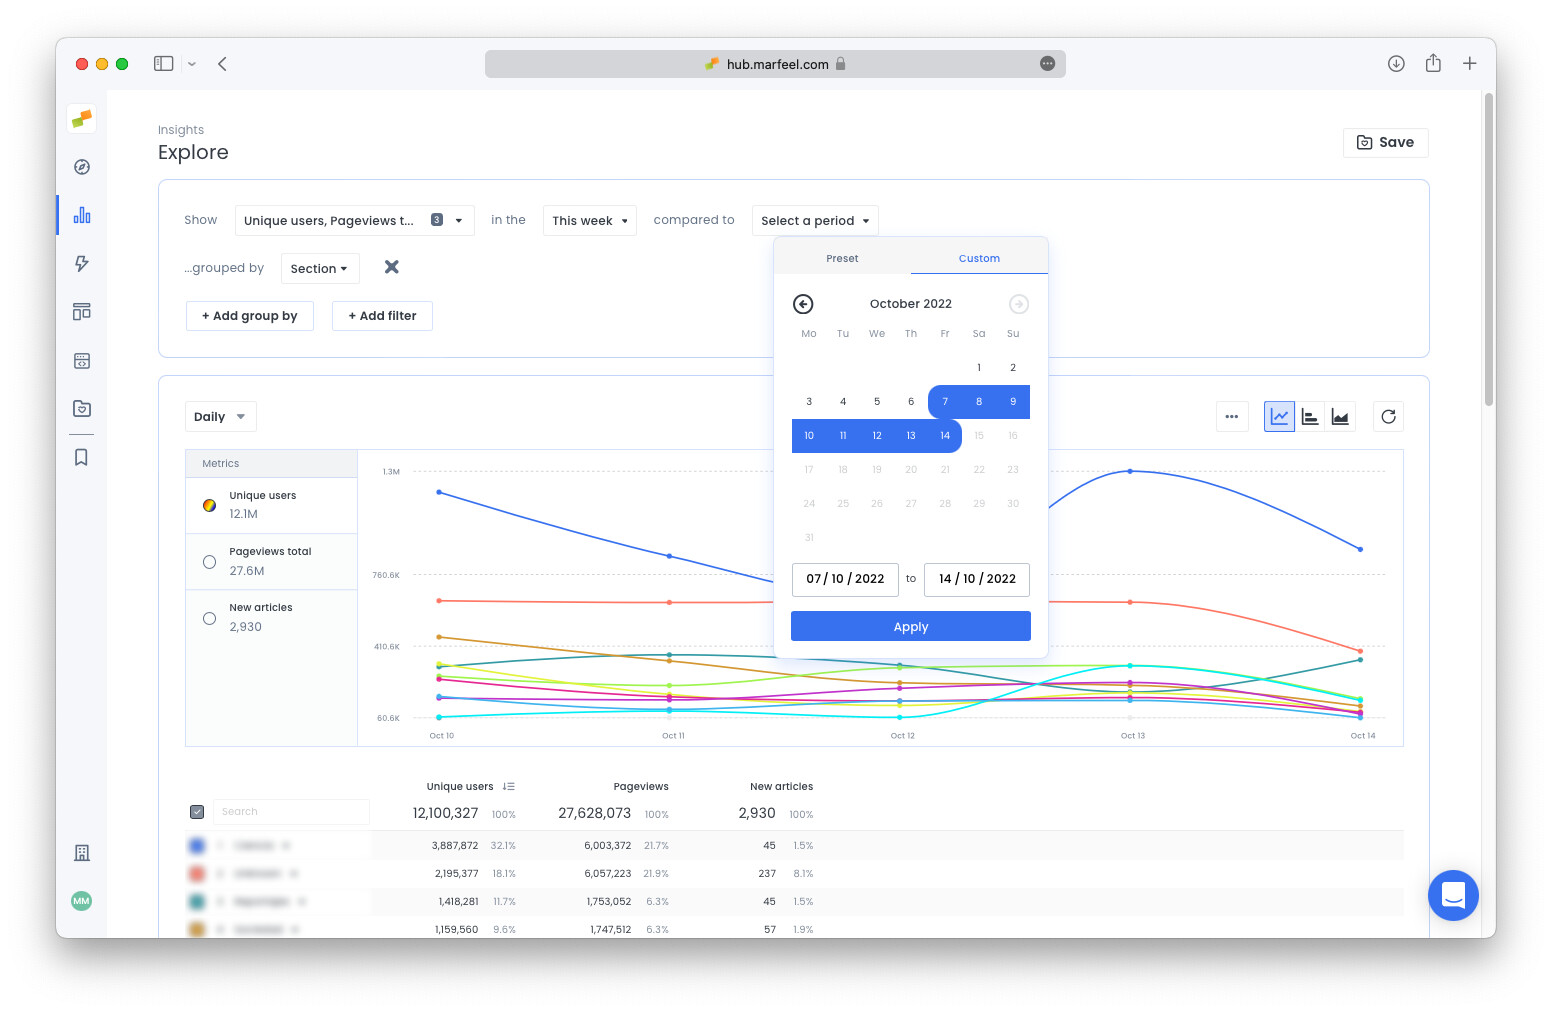
- You can now also compare to any custom date range:
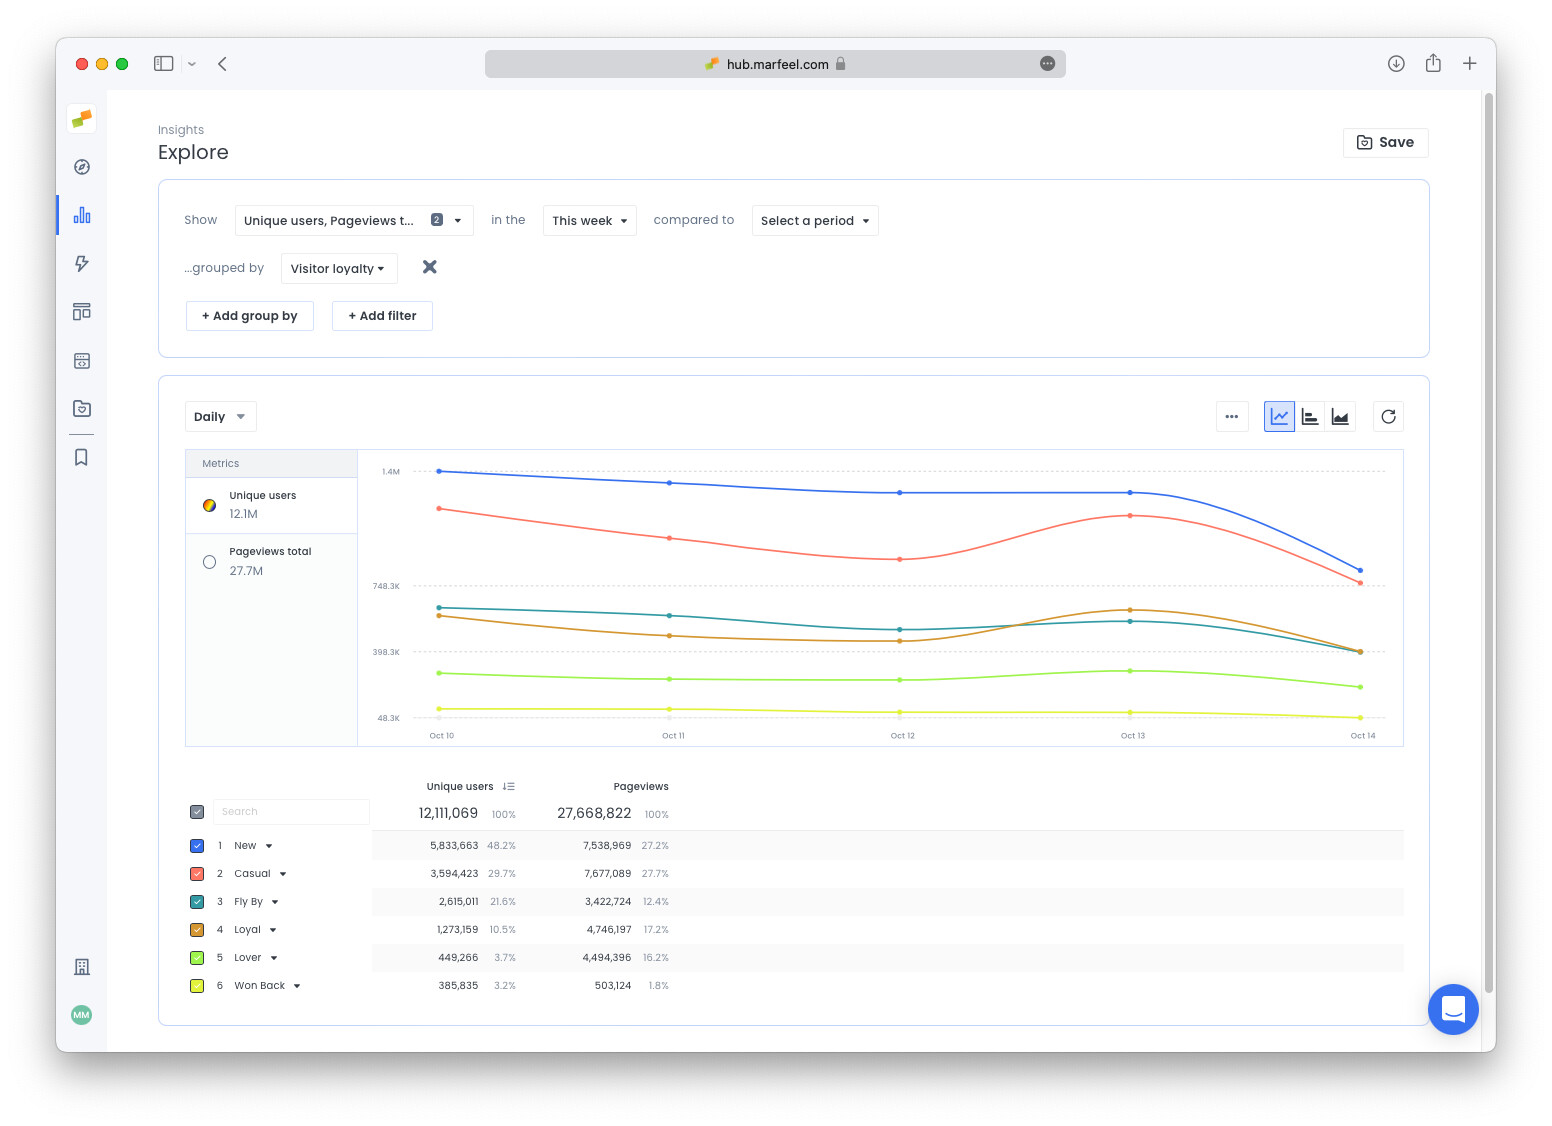
We’ve worked not only on the graphics but also on the table below where we’ve added several features to help you make decisions faster.
- Each row now has a number so you can see how many results there are.
- Each KPI now shows both the absolute number and the percent it represents compared to the total. i.e. you can quickly read from the table below that
Newusers represent 48.2% of the total users and bring in 27.2% of the total Pageviews.Loverson the other hand are only 3.7% of the users but bring in an impressive 16.2% of the Pageviews.
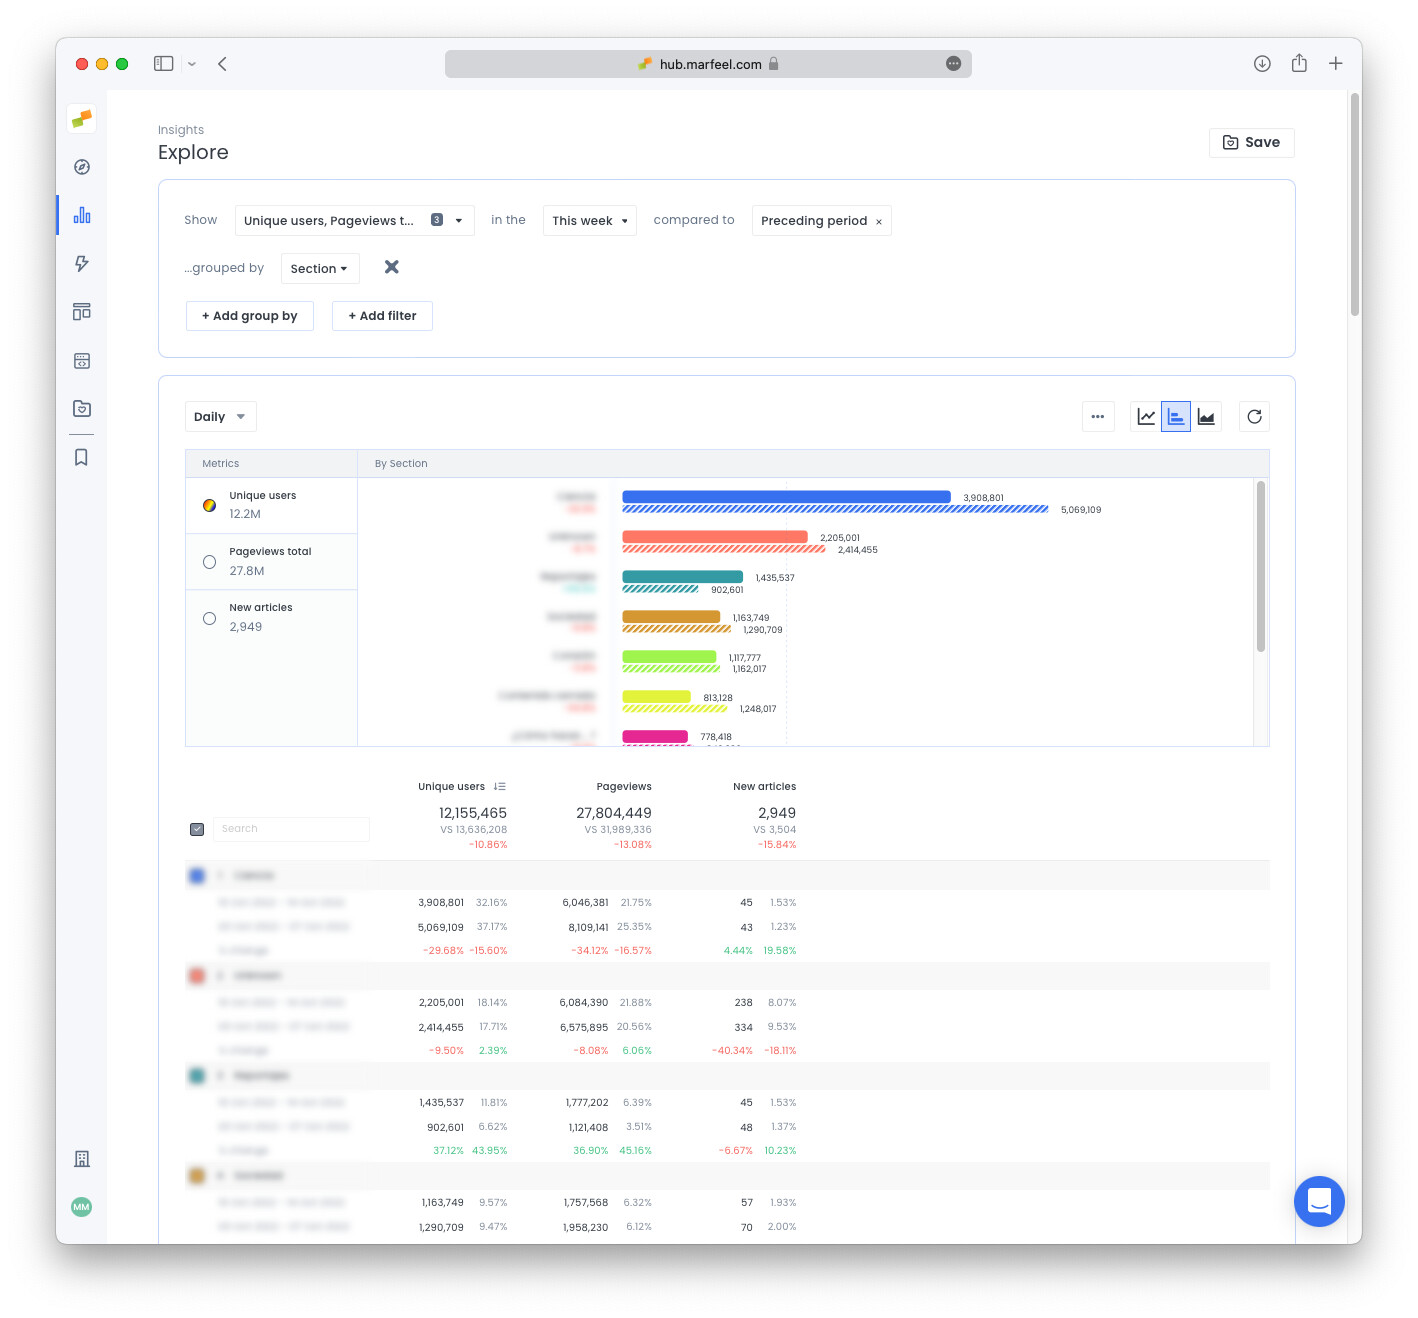
- You can now use the table view in comparison mode too. In the example below, we see Unique Users, Pageviews and total articles broken down by Section comparing the current week to the previous week. This report helps us spot the under and over performing sections that we should focus on.