Funnel charts in Marfeel Compass now display conversion percentages with enhanced precision and dual metrics, making it easier to identify optimization opportunities and understand user drop-off patterns.
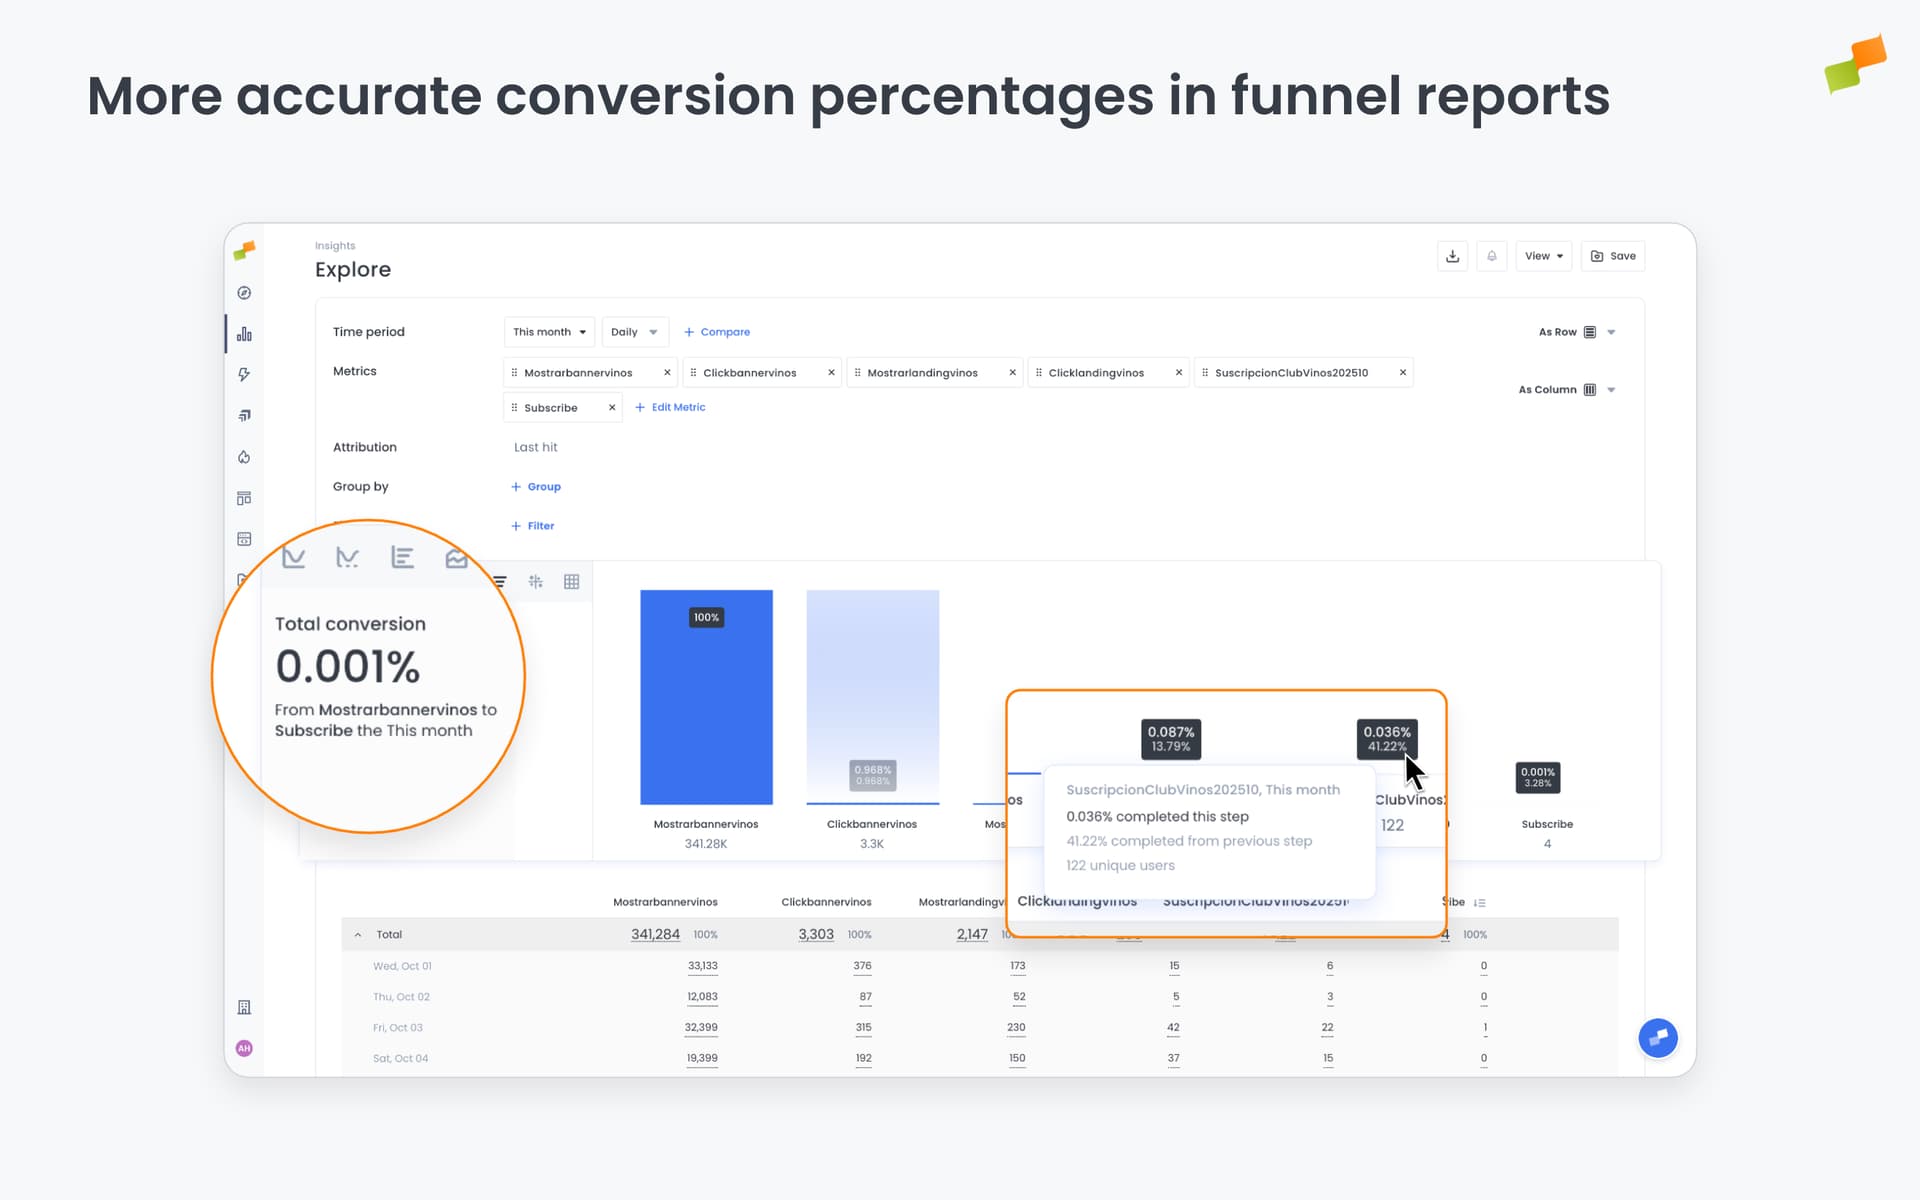
When tracking conversion funnels, small differences in percentages can reveal significant insights. The updated funnel visualization now displays conversion rates with adaptive precision: values below 1% show three decimal places, while larger percentages display two decimal places. This improvement helps teams spot subtle performance variations that might otherwise go unnoticed.
Each step in your funnel now presents two conversion metrics side by side. The primary percentage shows the overall conversion rate from the initial step, while a secondary metric displays the step-by-step conversion from the previous stage. This dual view eliminates the need to calculate intermediate conversion rates manually and provides immediate context for where users are dropping off in the journey.